Examples
This gallery contains a selection of examples of the plots mplsoccer can create.
All of the examples can be run from this Anaconda environment.
To install the environment yourself use the Anaconda Prompt:
Copy the code above into a blank file called
environment.yml, then run the following command from the directory containing the file.conda env create -f environment.yml
Activate the new environment:
conda activate mplsoccer
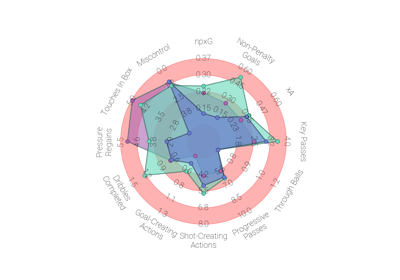
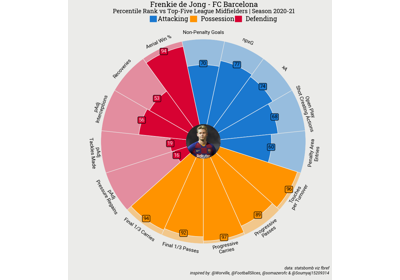
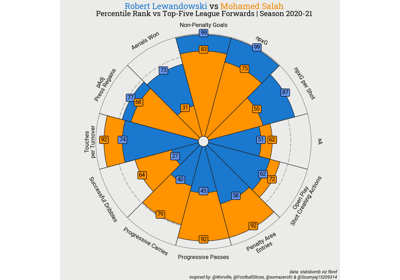
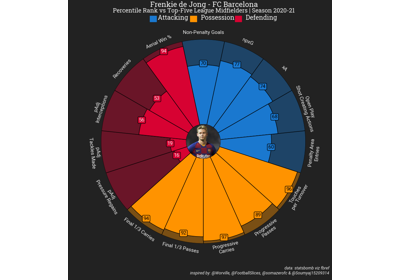
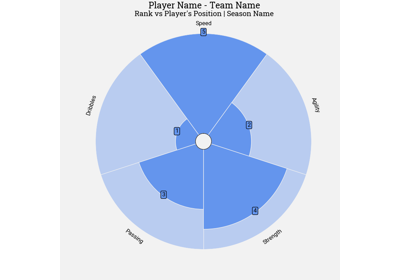
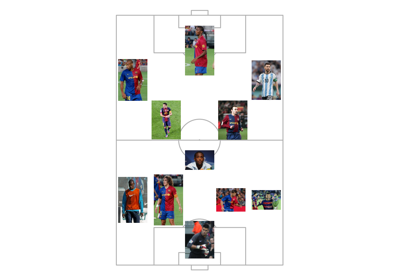
Radar charts
Examples of plotting a radar chart using mplsoccer.
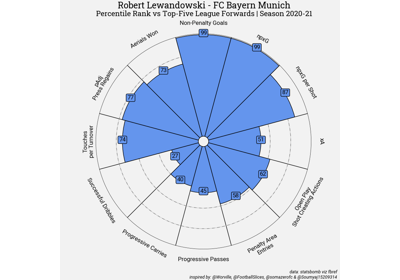
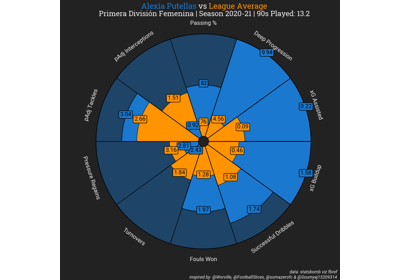
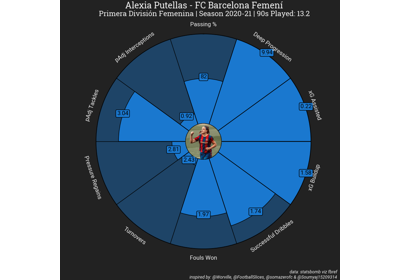
Pizza Plots
Examples of plotting a pizza plot using mplsoccer.
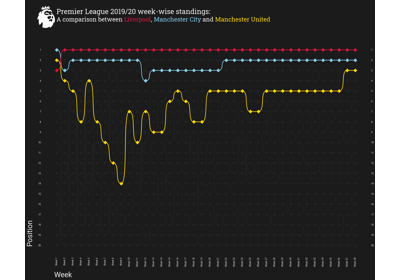
Bumpy Charts
Examples of plotting a bumpy chart using mplsoccer.
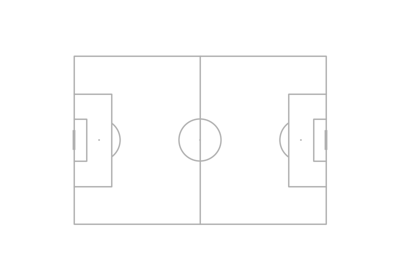
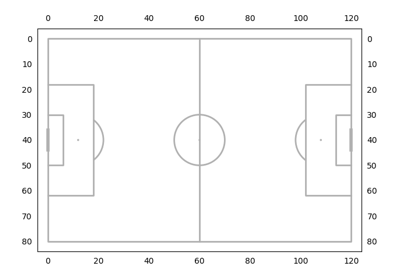
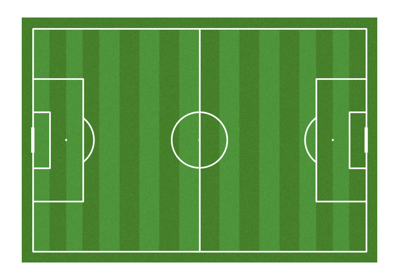
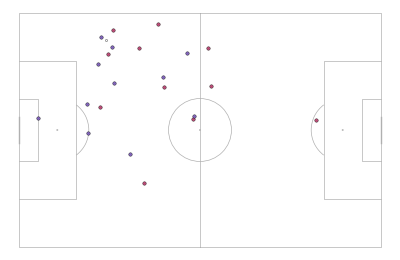
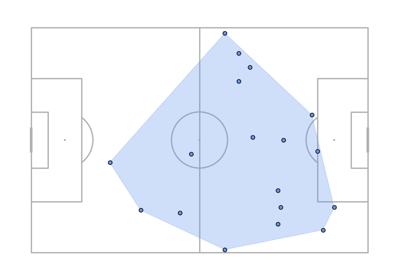
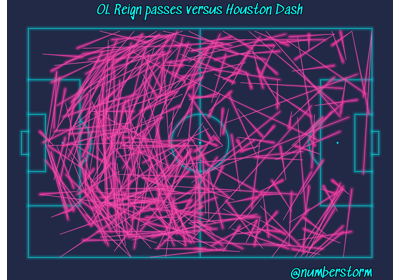
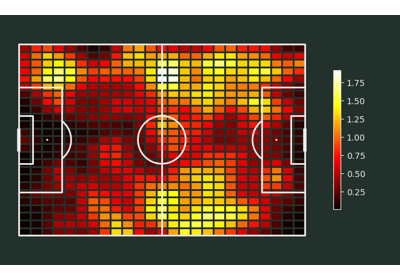
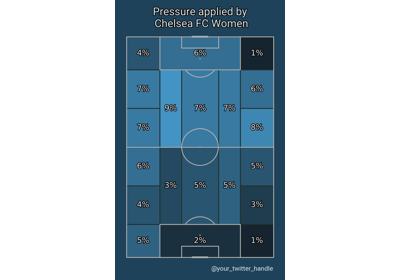
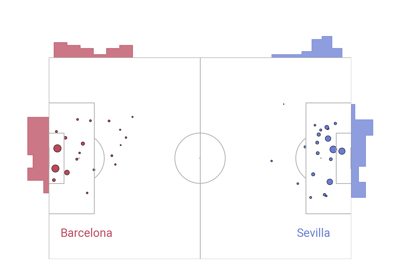
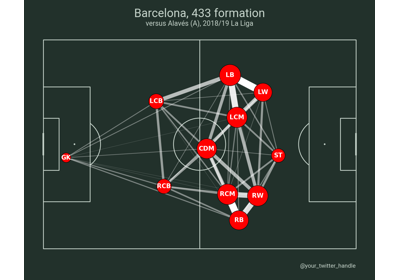
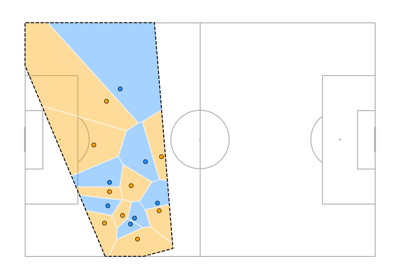
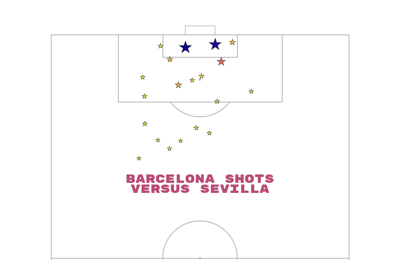
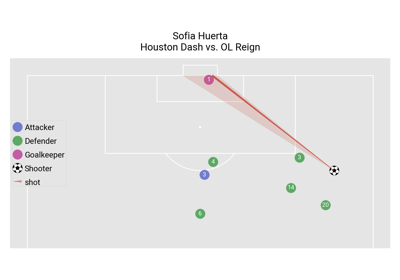
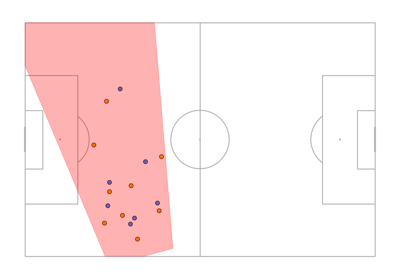
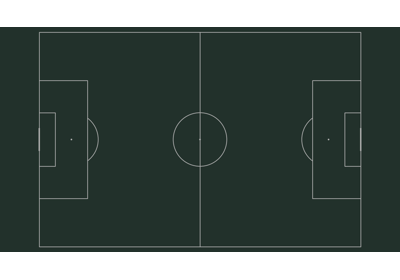
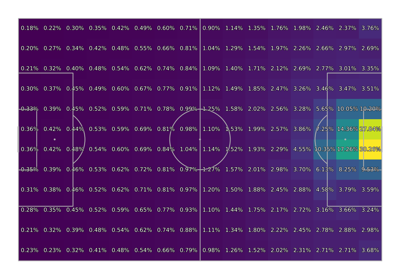
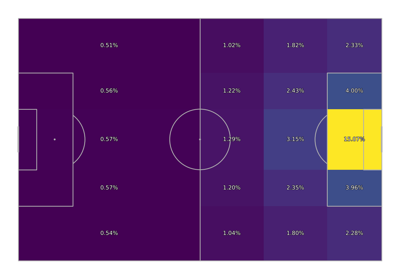
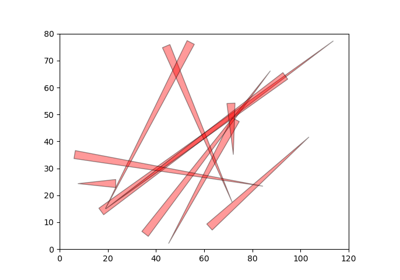
Pitches
Examples of the methods for plotting pitches in mplsoccer.


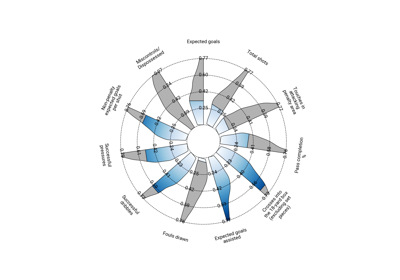
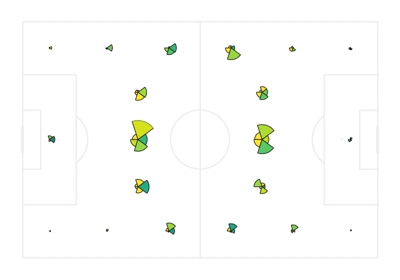
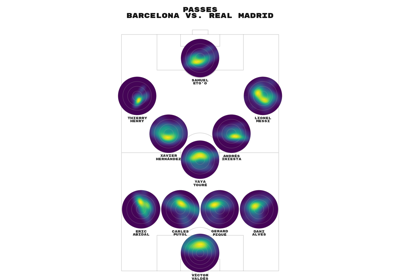
Sonars
Examples of the methods for plotting sonars in mplsoccer.


Tutorials
Tutorials for soccer data.
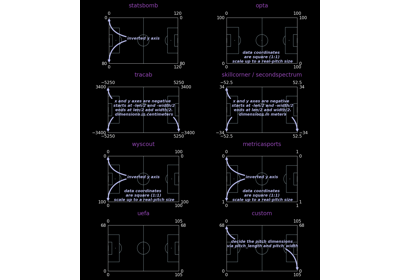
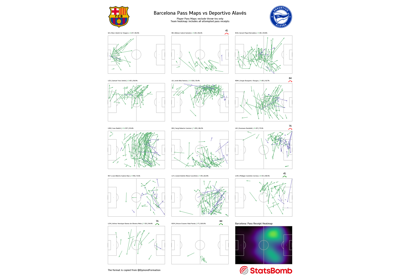
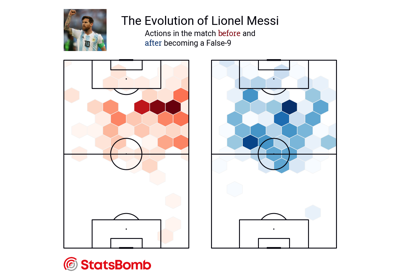
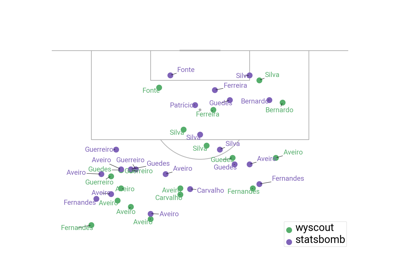
StatsBomb
Using real StatsBomb data for plotting.

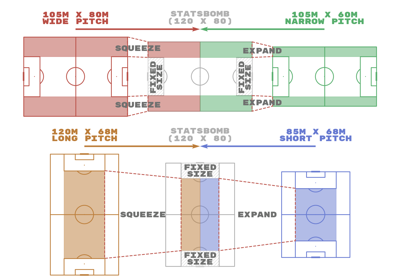
Pitch setup
How drawing the pitch works.