Note
Go to the end to download the full example code.
Plot wedges
This example shows how you can plot wedge and comet lines on normal axes.
import matplotlib.pyplot as plt
import numpy as np
Generate random data
First let’s generate some random data
np.random.seed(42)
x = np.random.uniform(0, 120, 10)
y = np.random.uniform(0, 80, 10)
x_end = np.random.uniform(0, 120, 10)
y_end = np.random.uniform(0, 80, 10)
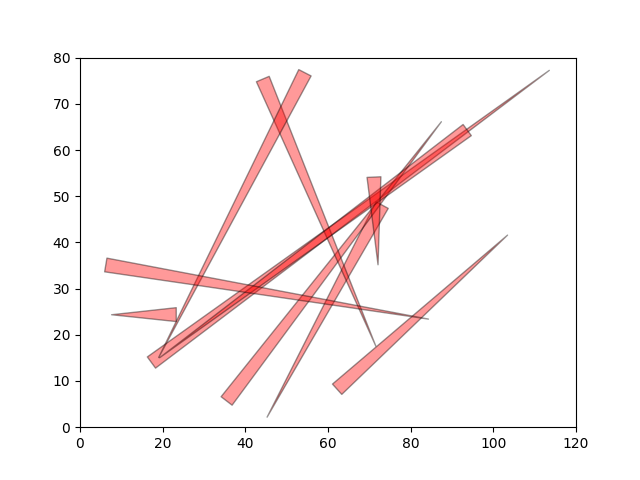
Plot using wedges
This shows how to plot the lines using wedges. The code was donated by Jon Ollington
fig, ax = plt.subplots()
ax.set_xlim(0, 120)
ax.set_ylim(0, 80)
for i in range(len(x)):
    ax.annotate('', xy=(x[i], y[i]), xytext=(x_end[i], y_end[i]), zorder=2,
                arrowprops=dict(arrowstyle="wedge,tail_width=1", linewidth=1,
                                fc='red', ec='black', alpha=0.4),
                )
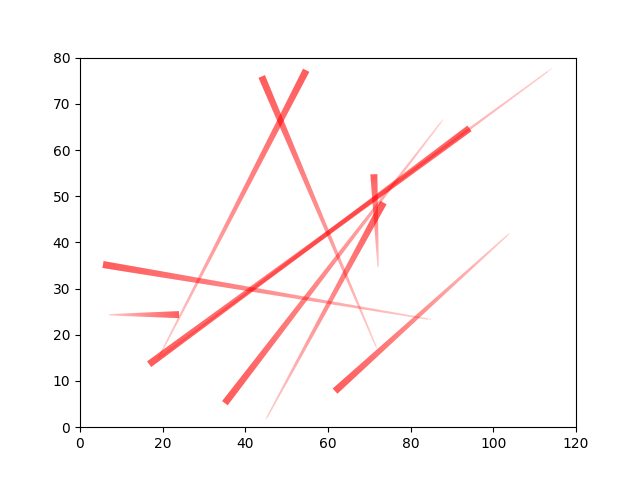
Plot using lines
You can also use mplsoccer’s lines function on normal axes.
from mplsoccer import lines

fig, ax = plt.subplots()
ax.set_xlim(0, 120)
ax.set_ylim(0, 80)
lc1 = lines(x, y, x_end, y_end, color='red', comet=True, transparent=True,
            alpha_start=0.1, alpha_end=0.4, ax=ax)
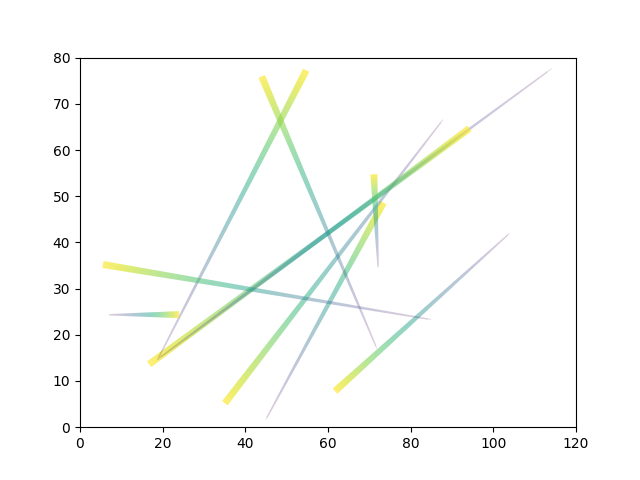
Plot using cmap
You can also use plot using a color map using mplsoccer’s lines function.
fig, ax = plt.subplots()
ax.set_xlim(0, 120)
ax.set_ylim(0, 80)
lc2 = lines(x, y, x_end, y_end, cmap='viridis', comet=True, transparent=True,
            alpha_start=0.1, alpha_end=0.4, ax=ax)

plt.show()  # If you are using a Jupyter notebook you do not need this line
Total running time of the script: (0 minutes 0.141 seconds)