Note
Go to the end to download the full example code.
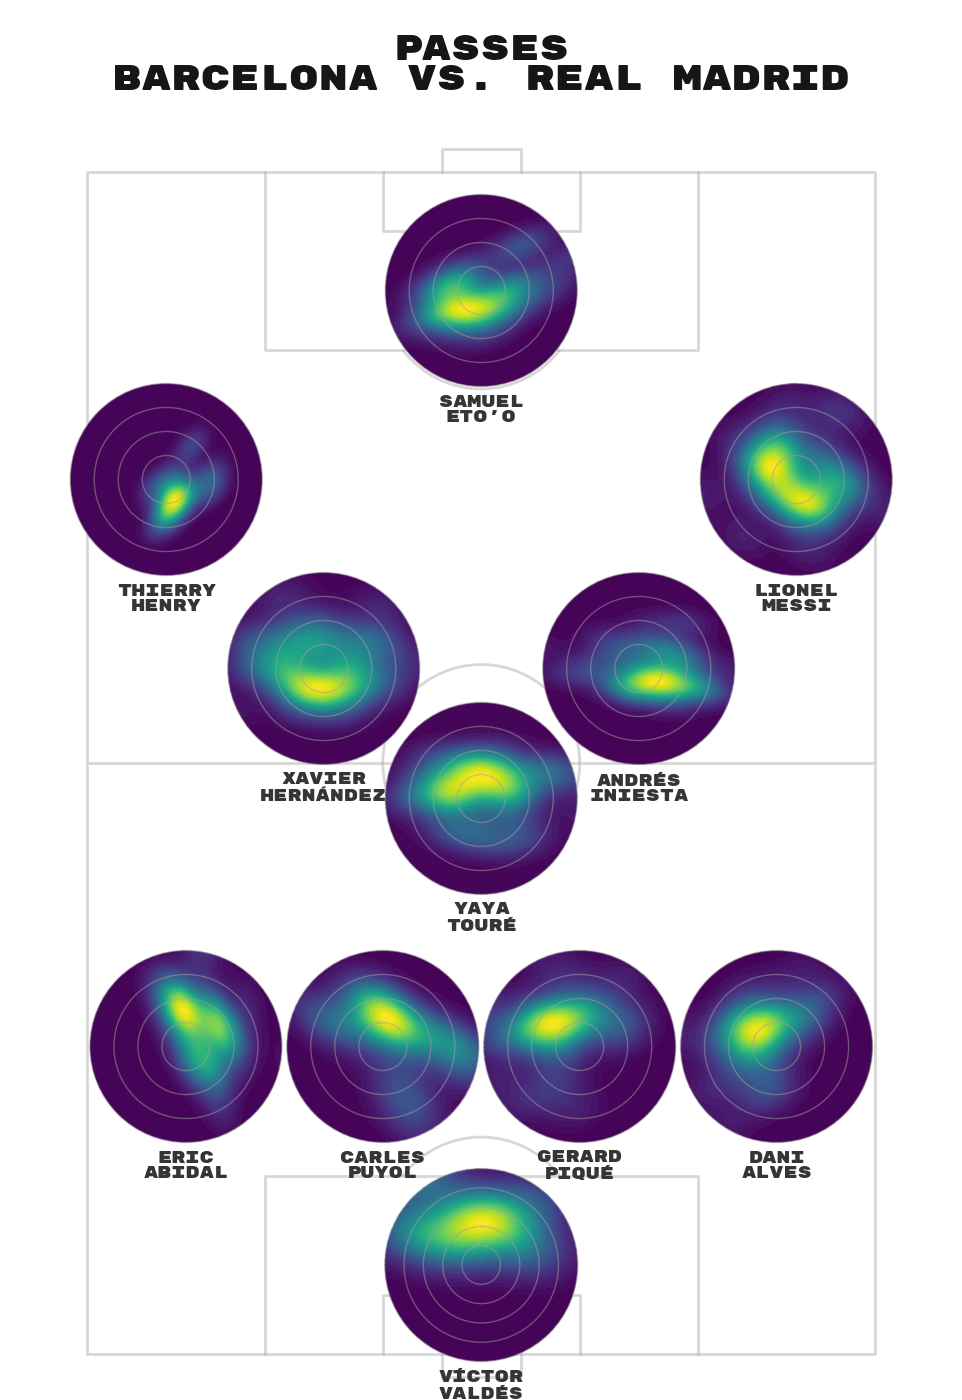
Pass Sonar Alternative
This example shows how to make an alternative to the pass sonar. The pass sonar was introduced by Eliot McKinley. The idea is to use a kernel density estimator (KDE) instead of a polar bar chart that is used in the usual pass sonar.
The steps to produce this are:
convert the pass start/ end points to angles (radians) and distance
convert to Cartesian coordinates so each pass start point is centered at coordinate x=0, y=0
plot the kernel density estimate of the new pass end points on a square inset axes
draw circles at intervals of ten, which that act as grid lines
cut the kernel density estimate contours to the last circle
I tried a lot of different techniques, but couldn’t get it to work plot on polar axes so gave up. I eventually stumbled on this solution after reading a stats stackexchange post.
import matplotlib.pyplot as plt
import numpy as np
from matplotlib.patches import Circle
from scipy.stats import gaussian_kde

from mplsoccer import VerticalPitch, Sbopen, FontManager

# data parser, fonts and path effects for giving the font an edge
parser = Sbopen()
pitch = VerticalPitch(goal_type='box', line_alpha=0.5, goal_alpha=0.5)
fm_rubik = FontManager('https://raw.githubusercontent.com/google/fonts/main/ofl/'
                       'rubikmonoone/RubikMonoOne-Regular.ttf')
Load StatsBomb data
Load the Starting XI and pass receptions for a Barcelona vs. Real Madrid match for plotting Barcelona’s starting formation.
event, related, freeze, tactics = parser.event(69249)
# starting players from Barcelona
starting_xi_event = event.loc[((event['type_name'] == 'Starting XI') &
                               (event['team_name'] == 'Barcelona')), ['id', 'tactics_formation']]
# joining on the team name and formation to the lineup
starting_xi = tactics.merge(starting_xi_event, on='id')
# replace player names with the shorter version
player_short_names = {'Víctor Valdés Arribas': 'Víctor Valdés',
                      'Daniel Alves da Silva': 'Dani Alves',
                      'Gerard Piqué Bernabéu': 'Gerard Piqué',
                      'Carles Puyol i Saforcada': 'Carles Puyol',
                      'Eric-Sylvain Bilal Abidal': 'Eric Abidal',
                      'Gnégnéri Yaya Touré': 'Yaya Touré',
                      'Andrés Iniesta Luján': 'Andrés Iniesta',
                      'Xavier Hernández Creus': 'Xavier Hernández',
                      'Lionel Andrés Messi Cuccittini': 'Lionel Messi',
                      'Thierry Henry': 'Thierry Henry',
                      "Samuel Eto''o Fils": "Samuel Eto'o"}
starting_xi['player_name'] = (starting_xi['player_name']
                              .replace(player_short_names)
                              .str.replace(' ', '\n')
                              )
# filter only succesful passes the starting XI
event = event.loc[((event['type_name'] == 'Pass') &
                   (event['outcome_name'].isnull()) &
                   (event['player_id'].isin(starting_xi['player_id']))
                   ), ['player_id', 'x', 'y', 'end_x', 'end_y']]
# merge on the starting positions to the events
event = event.merge(starting_xi, on='player_id')
formation = event['tactics_formation'].iloc[0]
Plot the data
fig, ax = pitch.grid(endnote_height=0, title_height=0.08, figheight=14, grid_width=0.9,
                     grid_height=0.9, axis=False)
title = ax['title'].text(0.5, 0.5, 'Passes\nBarcelona vs. Real Madrid', fontsize=25,
                         va='center',
                         ha='center', color='#161616', fontproperties=fm_rubik.prop)
player_names = pitch.formation(formation, positions=starting_xi.position_id,
                               xoffset=[-15, -12, -12, -12, -12, -6, -12, -12, -12, -12, -12],
                               text=starting_xi['player_name'],
                               kind='text', va='center', ha='center', fontproperties=fm_rubik.prop,
                               fontsize=12, ax=ax['pitch'], color='#353535')
axs = pitch.formation(formation, positions=starting_xi.position_id, height=20, aspect=1,
                      xoffset=[-3, 0, 0, 0, 0, 6, 0, 0, 0, 0, 0],
                      kind='axes', ax=ax['pitch'])

# grid for evaluating the kernel density estimator
X, Y = np.mgrid[-50:50:100j, -50:50:100j]
grid = np.vstack([X.ravel(), Y.ravel()])

for position in axs:

    # set the inset axes to square, here I made the goalkeeper larger as they tend to kick longer
    lim = 50 if position == 1 else 40
    num_lines = 5 if position == 1 else 4
    axs[position].set_xlim(-lim - 1, lim + 1)  # added some padding for plotting the last circle
    axs[position].set_ylim(-lim - 1, lim + 1)
    axs[position].axis('off')

    event_position = event[event.position_id == position].copy()
    angle_position, distance_position = pitch.calculate_angle_and_distance(event_position.x,
                                                                           event_position.y,
                                                                           event_position.end_x,
                                                                           event_position.end_y)
    x = distance_position * np.cos(angle_position)
    y = distance_position * np.sin(angle_position)
    xy = np.vstack([y, x])
    kde = gaussian_kde(xy)
    density = kde(grid).T.reshape(X.shape)

    # note on vertical pitches the kde needs to be rotated and X, Y switched
    if pitch.vertical:
        contours = axs[position].contourf(Y, X, np.rot90(density, k=3), cmap='viridis', levels=50,
                                          zorder=2)  # switch Y and X as plotted on a vertical pitch
    else:
        contours = axs[position].contourf(X, Y, density, cmap='viridis', levels=50, zorder=2)

    # add circles at intervals of ten
    for i in range(num_lines):
        lw = 3 if i == num_lines else 1  # make the last circle thicker
        circ = Circle((0, 0), (i + 1) * 10, ec='#a19e9d', lw=lw, alpha=0.5, fc='None', zorder=3)
        circ_artist = axs[position].add_artist(circ)

    # clip to the last circle
    contours.set_clip_path(circ_artist)

plt.show()  # If you are using a Jupyter notebook you do not need this line
Total running time of the script: (0 minutes 0.547 seconds)