Note
Go to the end to download the full example code.
Different Units Pizza
Author: slothfulwave612
mplsoccer,py_pizzamodule helps one to plot pizza charts in a few lines of code.The design idea is inspired by Tom Worville, Football Slices and Soma Zero FC
We have re-written Soumyajit Bose’s pizza chart code to enable greater customisation.
Here we plot a pizza chart where the parameters have the same units, but the maximum is five instead of 100.
import matplotlib.pyplot as plt

from mplsoccer import PyPizza, FontManager
Load some fonts
We will use mplsoccer’s FontManager to load some fonts from Google Fonts. We borrowed the FontManager from the excellent ridge_map library.
font_normal = FontManager('https://raw.githubusercontent.com/googlefonts/roboto/main/'
                          'src/hinted/Roboto-Regular.ttf')
font_italic = FontManager('https://raw.githubusercontent.com/googlefonts/roboto/main/'
                          'src/hinted/Roboto-Italic.ttf')
font_bold = FontManager('https://raw.githubusercontent.com/google/fonts/main/apache/robotoslab/'
                        'RobotoSlab[wght].ttf')
Different Units
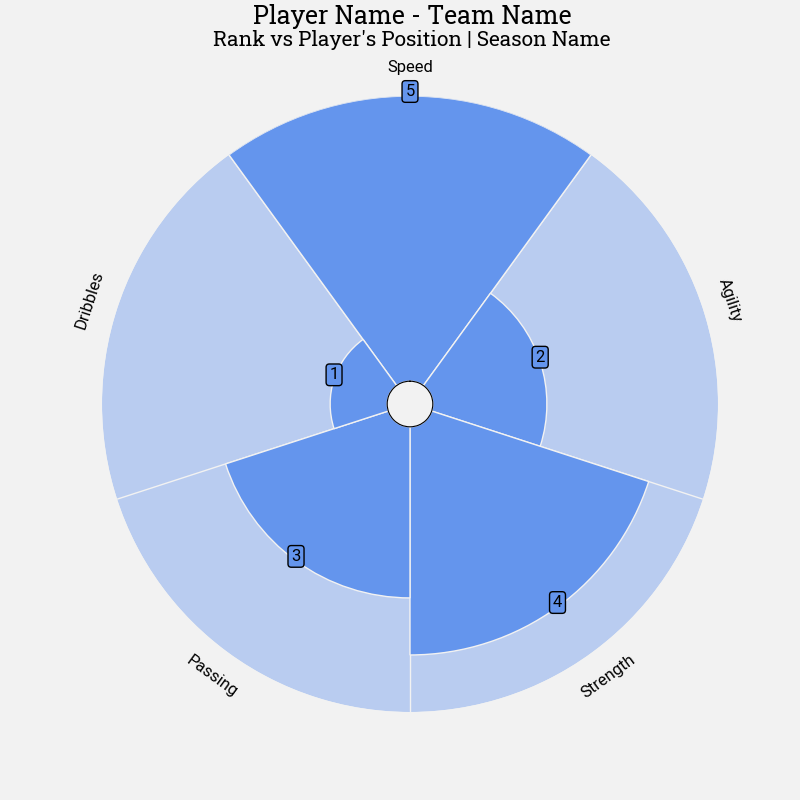
Till now we were plotting a percentile chart where the upper limit was 100. Let’s take another example where the lower limit is 0 and upper limit is 5. The below code shows how to plot pizza-chart for such case.
# parameter and value list
params = ['Speed', 'Agility', 'Strength', 'Passing', 'Dribbles']
values = [5, 2, 4, 3, 1]

# instantiate PyPizza class
baker = PyPizza(
    params=params,                  # list of parameters
    straight_line_color="#F2F2F2",  # color for straight lines
    straight_line_lw=1,             # linewidth for straight lines
    straight_line_limit=5.0,        # max limit of straight lines
    last_circle_lw=0,               # linewidth of last circle
    other_circle_lw=0,              # linewidth for other circles
    inner_circle_size=0.4,          # size of inner circle
)

# plot pizza
fig, ax = baker.make_pizza(
    values,                     # list of values
    figsize=(8, 8),             # adjust figsize according to your need
    color_blank_space="same",   # use same color to fill blank space
    blank_alpha=0.4,            # alpha for blank-space colors
    param_location=5.5,         # where the parameters will be added
    kwargs_slices=dict(
        facecolor="cornflowerblue", edgecolor="#F2F2F2",
        zorder=2, linewidth=1
    ),                          # values to be used when plotting slices
    kwargs_params=dict(
        color="#000000", fontsize=12,
        fontproperties=font_normal.prop, va="center"
    ),                          # values to be used when adding parameter
    kwargs_values=dict(
        color="#000000", fontsize=12,
        fontproperties=font_normal.prop, zorder=3,
        bbox=dict(
            edgecolor="#000000", facecolor="cornflowerblue",
            boxstyle="round,pad=0.2", lw=1
        )
    )                           # values to be used when adding parameter-values
)

# add title
fig.text(
    0.515, 0.97, "Player Name - Team Name", size=18,
    ha="center", fontproperties=font_bold.prop, color="#000000"
)

# add subtitle
fig.text(
    0.515, 0.942,
    "Rank vs Player's Position | Season Name",
    size=15,
    ha="center", fontproperties=font_bold.prop, color="#000000"
)

plt.show()
Total running time of the script: (0 minutes 0.184 seconds)