Note
Go to the end to download the full example code.
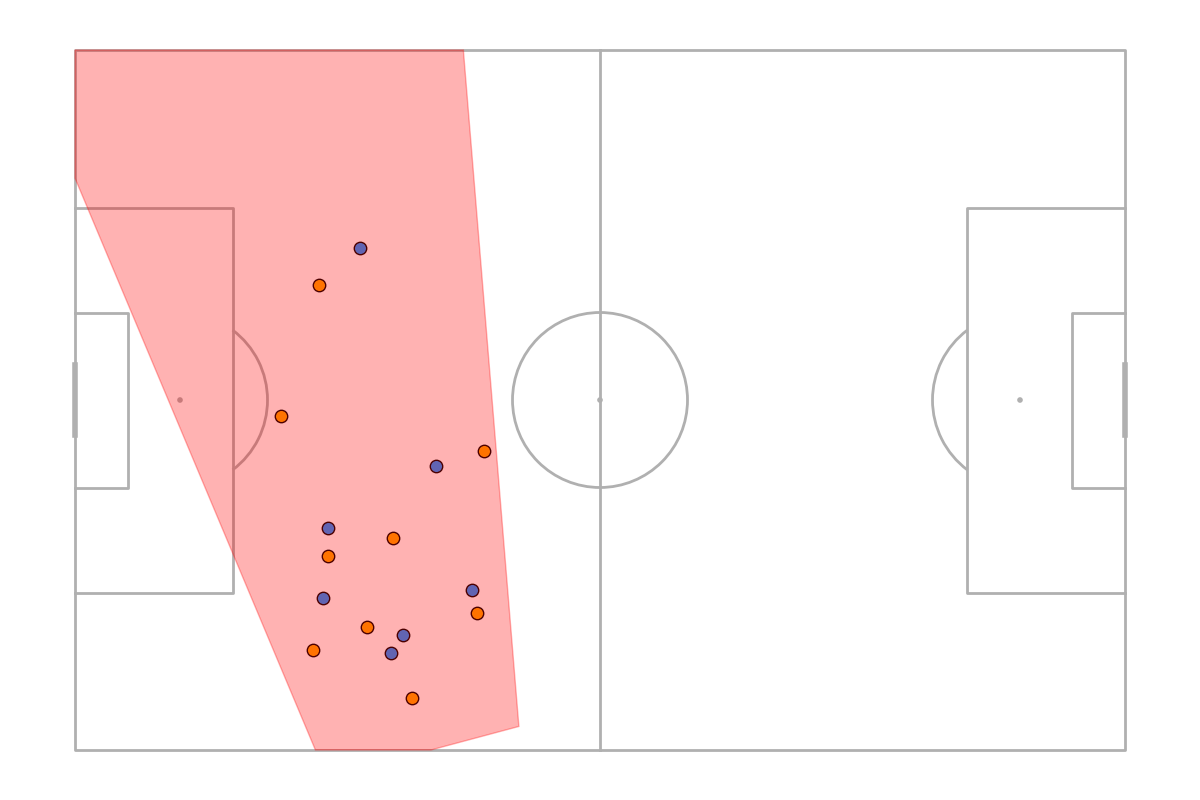
StatsBomb 360
This example shows how to plot the StatsBomb 360 data. Code by @abhisheksh_98
import matplotlib.pyplot as plt
from mplsoccer import Pitch, Sbopen
import numpy as np

## load in Statsbomb360 data remotely
parser = Sbopen()
frames, visible = parser.frame(3788741)

## get plotting data
frame_idx = 50
frame_id = visible.iloc[50].id

visible_area = np.array(visible.iloc[frame_idx].visible_area).reshape(-1, 2)
player_position_data = frames[frames.id == frame_id]

teammate_locs = player_position_data[player_position_data.teammate]
opponent_locs = player_position_data[~player_position_data.teammate]

## set up pitch
p = Pitch(pitch_type='statsbomb')
fig, ax = p.draw(figsize=(12,8))

p.scatter(teammate_locs.x, teammate_locs.y, c='orange', s=80, ec='k', ax=ax)
p.scatter(opponent_locs.x, opponent_locs.y, c='dodgerblue', s=80, ec='k', ax=ax)
p.polygon([visible_area], color=(1, 0, 0, 0.3), ax=ax)

plt.show() ##to see the plot. You don't need this if you're using a jupyter notebook
Total running time of the script: (0 minutes 0.284 seconds)