Note
Go to the end to download the full example code.
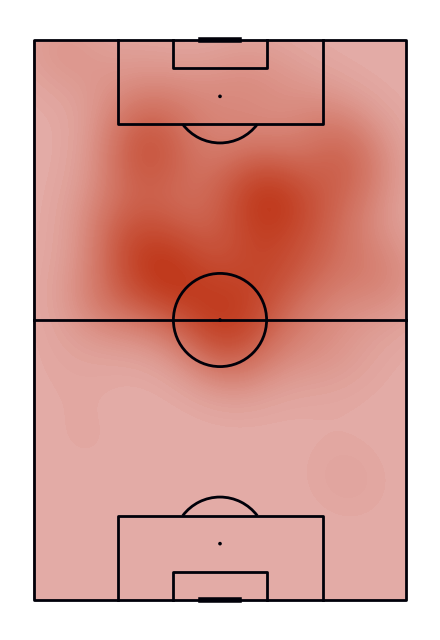
Event distribution using kdeplot
This example shows how to plot the location of events occurring in a match using kernel density estimation (KDE).
from urllib.request import urlopen, Request

from matplotlib.colors import LinearSegmentedColormap
import matplotlib.pyplot as plt
from PIL import Image
from highlight_text import ax_text

from mplsoccer import VerticalPitch, add_image, FontManager, Sbopen
Load the first game that Messi played as a false-9 and the match before.
parser = Sbopen()
df_false9 = parser.event(69249)[0]  # 0 index is the event file
df_before_false9 = parser.event(69251)[0]  # 0 index is the event file
# filter messi's actions (starting positions)
df_false9 = df_false9.loc[df_false9.player_id == 5503, ['x', 'y']]
df_before_false9 = df_before_false9.loc[df_before_false9.player_id == 5503, ['x', 'y']]
Create a custom colormap. Note see the custom colormaps example for more ideas.
flamingo_cmap = LinearSegmentedColormap.from_list("Flamingo - 100 colors",
                                                  ['#e3aca7', '#c03a1d'], N=100)
Plot Messi’s first game as a false-9.
pitch = VerticalPitch(line_color='#000009', line_zorder=2)
fig, ax = pitch.draw(figsize=(4.4, 6.4))
kde = pitch.kdeplot(df_false9.x, df_false9.y, ax=ax,
                    # fill using 100 levels so it looks smooth
                    fill=True, levels=100,
                    # shade the lowest area so it looks smooth
                    # so even if there are no events it gets some color
                    thresh=0,
                    cut=4,  # extended the cut so it reaches the bottom edge
                    cmap=flamingo_cmap)
Load a custom font.
URL = 'https://raw.githubusercontent.com/googlefonts/roboto/main/src/hinted/Roboto-Regular.ttf'
URL2 = 'https://raw.githubusercontent.com/google/fonts/main/apache/robotoslab/RobotoSlab[wght].ttf'
robotto_regular = FontManager(URL)
robboto_bold = FontManager(URL2)
Load images.
# Load the StatsBomb logo and Messi picture
MESSI_URL = 'https://upload.wikimedia.org/wikipedia/commons/b/b8/Messi_vs_Nigeria_2018.jpg'
request = Request(MESSI_URL)
request.add_header('User-Agent', 'mplsoccerdocs (https://mplsoccer.rtfd.io)')
messi_image = Image.open(urlopen(request))
SB_LOGO_URL = ('https://raw.githubusercontent.com/statsbomb/open-data/'
               'master/img/SB%20-%20Icon%20Lockup%20-%20Colour%20positive.png')
sb_logo = Image.open(urlopen(SB_LOGO_URL))
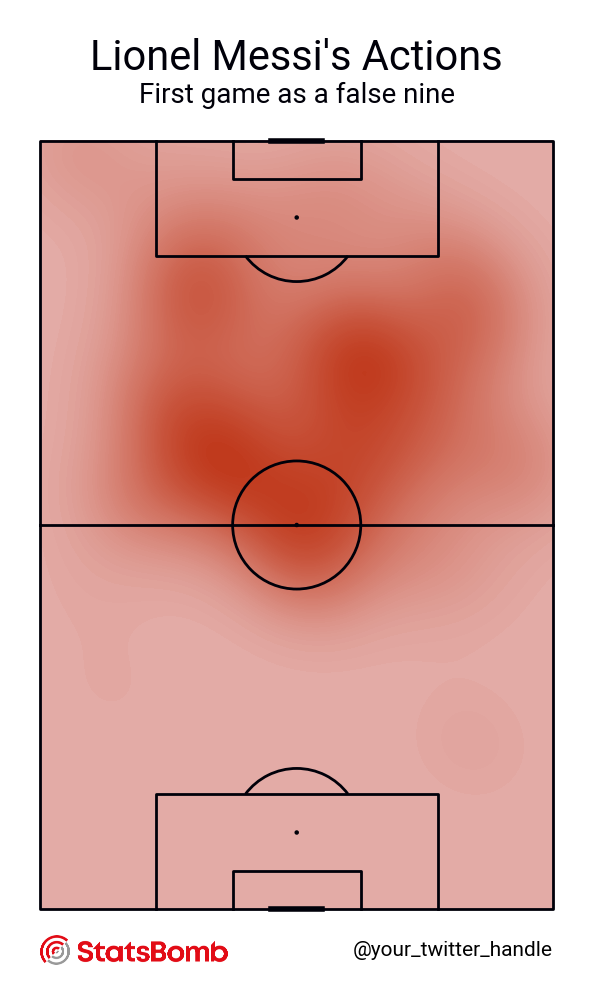
Plot the chart again with a title. We will use mplsoccer’s grid function to plot a pitch with a title and endnote axes.
fig, axs = pitch.grid(figheight=10, title_height=0.08, endnote_space=0, title_space=0,
                      # Turn off the endnote/title axis. I usually do this after
                      # I am happy with the chart layout and text placement
                      axis=False,
                      grid_height=0.82, endnote_height=0.03)
kde = pitch.kdeplot(df_false9.x, df_false9.y, ax=axs['pitch'],
                    # fill using 100 levels so it looks smooth
                    fill=True, levels=100,
                    # shade the lowest area so it looks smooth
                    # so even if there are no events it gets some color
                    thresh=0,
                    cut=4,  # extended the cut so it reaches the bottom edge
                    cmap=flamingo_cmap)
axs['endnote'].text(1, 0.5, '@your_twitter_handle', va='center', ha='right', fontsize=15,
                    fontproperties=robotto_regular.prop)
axs['title'].text(0.5, 0.7, "Lionel Messi's Actions", color='#000009',
                  va='center', ha='center', fontproperties=robotto_regular.prop, fontsize=30)
axs['title'].text(0.5, 0.25, "First game as a false nine", color='#000009',
                  va='center', ha='center', fontproperties=robotto_regular.prop, fontsize=20)
ax_sb_logo = add_image(sb_logo, fig,
                       # set the left, bottom and height to align with the endnote
                       left=axs['endnote'].get_position().x0,
                       bottom=axs['endnote'].get_position().y0,
                       height=axs['endnote'].get_position().height)
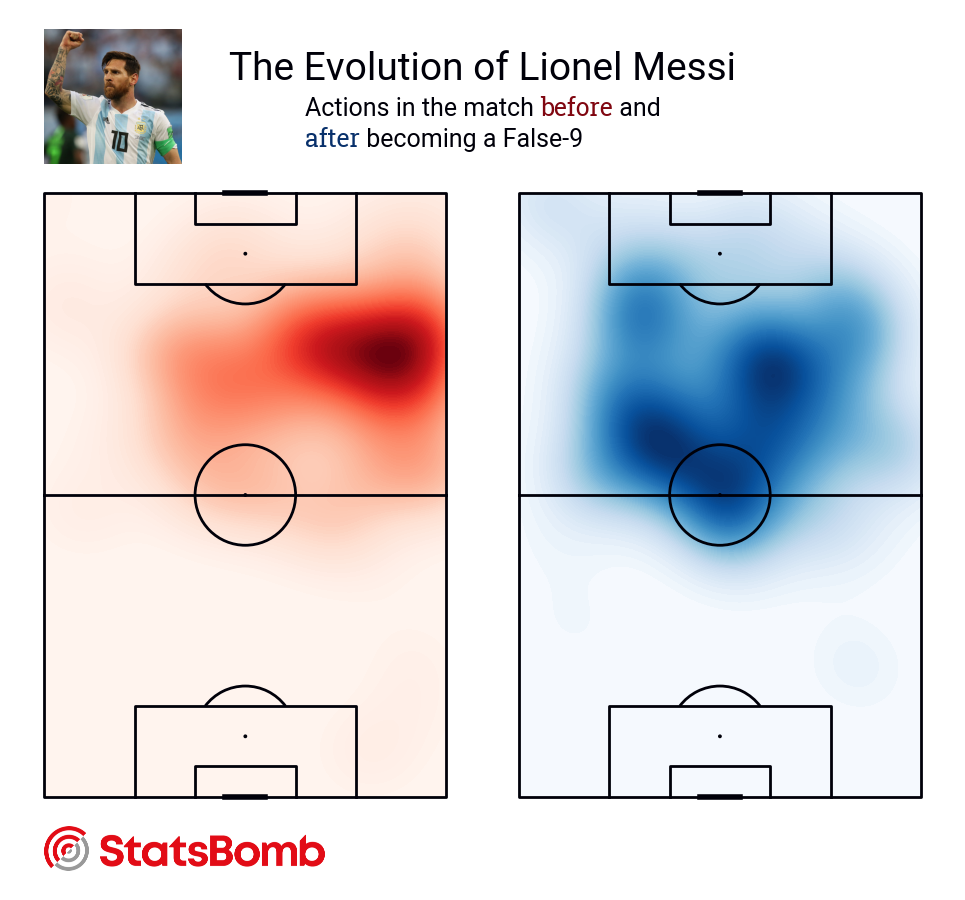
Plot Messi’s actions in the matches before and after becoming a false-9. We will use mplsoccer’s grid function, which is a convenient way to plot a grid of pitches with a title and endnote axes.
fig, axs = pitch.grid(ncols=2, axis=False, endnote_height=0.05)

kde_before = pitch.kdeplot(df_before_false9.x, df_before_false9.y, ax=axs['pitch'][0],
                           fill=True, levels=100, thresh=0,
                           cut=4, cmap='Reds')

kde_after = pitch.kdeplot(df_false9.x, df_false9.y, ax=axs['pitch'][1],
                          fill=True, levels=100, thresh=0,
                          cut=4, cmap='Blues')

ax_sb_logo = add_image(sb_logo, fig,
                       # set the left, bottom and height to align with the endnote
                       left=axs['endnote'].get_position().x0,
                       bottom=axs['endnote'].get_position().y0,
                       height=axs['endnote'].get_position().height)
ax_messi = add_image(messi_image, fig, interpolation='hanning',
                     # set the left, bottom and height to align with the title
                     left=axs['title'].get_position().x0,
                     bottom=axs['title'].get_position().y0,
                     height=axs['title'].get_position().height)

# titles using highlight_text and a google font (Robotto)

TITLE_STR1 = 'The Evolution of Lionel Messi'
TITLE_STR2 = 'Actions in the match <before> and\n<after> becoming a False-9'
title1_text = axs['title'].text(0.5, 0.7, TITLE_STR1, fontsize=28, color='#000009',
                                fontproperties=robotto_regular.prop,
                                ha='center', va='center')
highlight_text = [{'color': '#800610', 'fontproperties': robboto_bold.prop},
                  {'color': '#08306b', 'fontproperties': robboto_bold.prop}]
ax_text(0.5, 0.3, TITLE_STR2, ha='center', va='center', fontsize=18, color='#000009',
        fontproperties=robotto_regular.prop,
        highlight_textprops=highlight_text, ax=axs['title'])

# sphinx_gallery_thumbnail_path = 'gallery/pitch_plots/images/sphx_glr_plot_kde_003.png'

# Messi Photo from: https://en.wikipedia.org/wiki/Lionel_Messi#/media/File:Messi_vs_Nigeria_2018.jpg
# License: https://creativecommons.org/licenses/by-sa/3.0/;
# Creator: Кирилл Венедиктов

plt.show()  # If you are using a Jupyter notebook you do not need this line
Total running time of the script: (0 minutes 1.803 seconds)