Note
Go to the end to download the full example code.
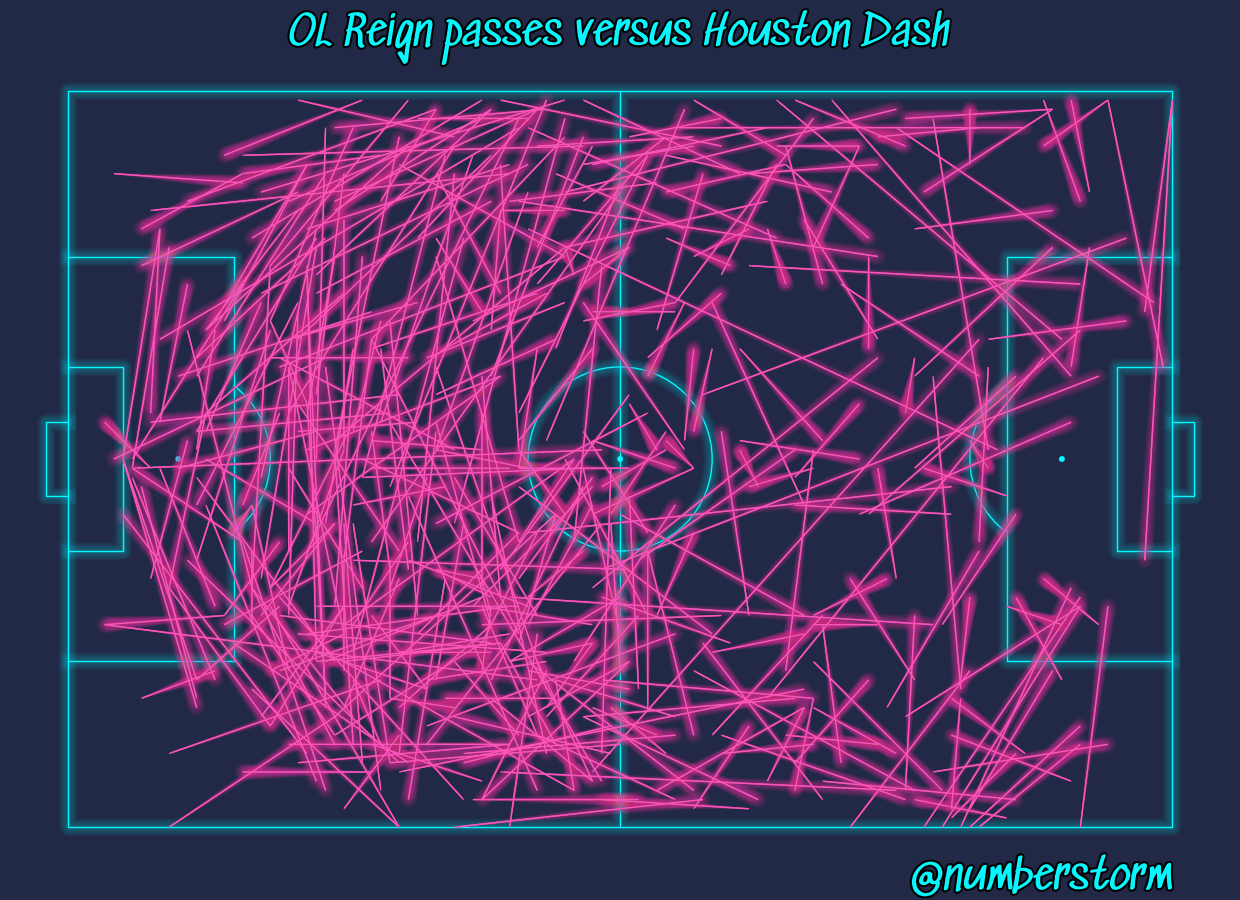
Cyberpunk theme
This example shows how to recreate the mplcyberpunk theme in mplsoccer.
It copies the technique of plotting the line once and adding glow effects. The glow effects are a loop of transparent lines increasing in linewidth so the center is more opaque than the outside.
from mplsoccer import Pitch, FontManager, Sbopen
import matplotlib.patheffects as path_effects

# read data
parser = Sbopen()
df, related, freeze, tactics = parser.event(7478)

# get the team names
team1, team2 = df.team_name.unique()
# filter the dataset to completed passes for team 1
mask_team1 = (df.type_name == 'Pass') & (df.team_name == team1) & (df.outcome_name.isnull())
df_pass = df.loc[mask_team1, ['x', 'y', 'end_x', 'end_y', 'outcome_name']]

# load a custom font from google fonts
fm = FontManager('https://raw.githubusercontent.com/google/fonts/main/ofl/sedgwickave/'
                 'SedgwickAve-Regular.ttf')
Plotting cybperpunk passes
LINEWIDTH = 1  # starting linewidth
DIFF_LINEWIDTH = 1.2  # amount the glow linewidth increases each loop
NUM_GLOW_LINES = 10  # the amount of loops, if you increase the glow will be wider

# in each loop, for the glow, we plot the alpha divided by the num_glow_lines
# I have a lower alpha_pass_line value as there is a slight overlap in
# the pass comet lines when using capstyle='round'
ALPHA_PITCH_LINE = 0.3
ALPHA_PASS_LINE = 0.15

# The colors are borrowed from mplcyberpunk. Try some of the following alternatives
# '#08F7FE' (teal/cyan), '#FE53BB' (pink), '#F5D300' (yellow),
# '#00ff41' (matrix green), 'r' (red), '#9467bd' (viloet)
BACKGROUND_COLOR = '#212946'
PASS_COLOR = '#FE53BB'
LINE_COLOR = '#08F7FE'

# plot as initial pitch and the lines with alpha=1
# I have used grid to get a title and endnote axis automatically, but you could you pitch.draw()
pitch = Pitch(line_color=LINE_COLOR, pitch_color=BACKGROUND_COLOR, linewidth=LINEWIDTH,
              line_alpha=1, goal_alpha=1, goal_type='box')
fig, ax = pitch.grid(grid_height=0.9, title_height=0.06, axis=False,
                     endnote_height=0.04, title_space=0, endnote_space=0)
fig.set_facecolor(BACKGROUND_COLOR)
pitch.lines(df_pass.x, df_pass.y,
            df_pass.end_x, df_pass.end_y,
            capstyle='butt',  # cut-off the line at the end-location.
            linewidth=LINEWIDTH, color=PASS_COLOR, comet=True, ax=ax['pitch'])

# plotting the titles and endnote
text_effects = [path_effects.Stroke(linewidth=3, foreground='black'),
                path_effects.Normal()]
ax['title'].text(0.5, 0.3, f'{team1} passes versus {team2}',
                 path_effects=text_effects,
                 va='center', ha='center', color=LINE_COLOR, fontsize=30, fontproperties=fm.prop)
ax['endnote'].text(1, 0.5, '@numberstorm', va='center', path_effects=text_effects,
                   ha='right', color=LINE_COLOR, fontsize=30, fontproperties=fm.prop)

# plotting the glow effect. it is essentially a loop that plots the line with
# a low alpha (transparency) value and gradually increases the linewidth.
# This way the center will have more color than the outer area.
# you could break this up into two loops if you wanted the pitch lines to have wider glow
for i in range(1, NUM_GLOW_LINES + 1):
    pitch = Pitch(line_color=LINE_COLOR, pitch_color=BACKGROUND_COLOR,
                  linewidth=LINEWIDTH + (DIFF_LINEWIDTH * i),
                  line_alpha=ALPHA_PITCH_LINE / NUM_GLOW_LINES,
                  goal_alpha=ALPHA_PITCH_LINE / NUM_GLOW_LINES,
                  goal_type='box')
    pitch.draw(ax=ax['pitch'])  # we plot on-top of our previous axis from pitch.grid
    pitch.lines(df_pass.x, df_pass.y,
                df_pass.end_x, df_pass.end_y,
                linewidth=LINEWIDTH + (DIFF_LINEWIDTH * i),
                capstyle='round',  # capstyle round so the glow extends past the line
                alpha=ALPHA_PASS_LINE / NUM_GLOW_LINES,
                color=PASS_COLOR, comet=True, ax=ax['pitch'])
Total running time of the script: (0 minutes 4.608 seconds)