Note
Go to the end to download the full example code.
Quick start
import matplotlib.pyplot as plt
from mplsoccer import Pitch, Radar
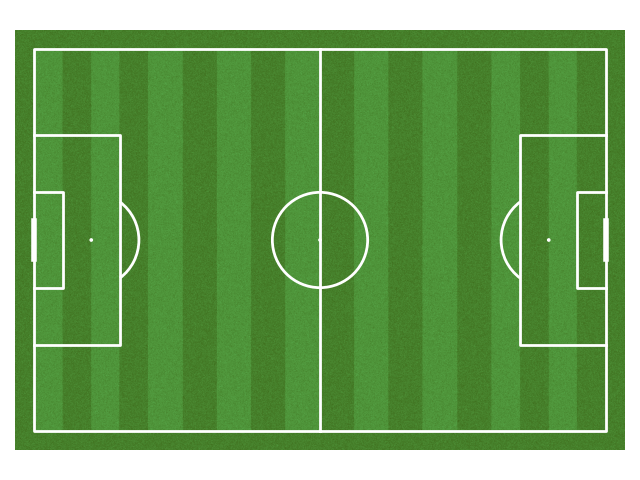
# plot a StatsBomb pitch
pitch = Pitch(pitch_color='grass', line_color='white', stripe=True)
fig, ax = pitch.draw()
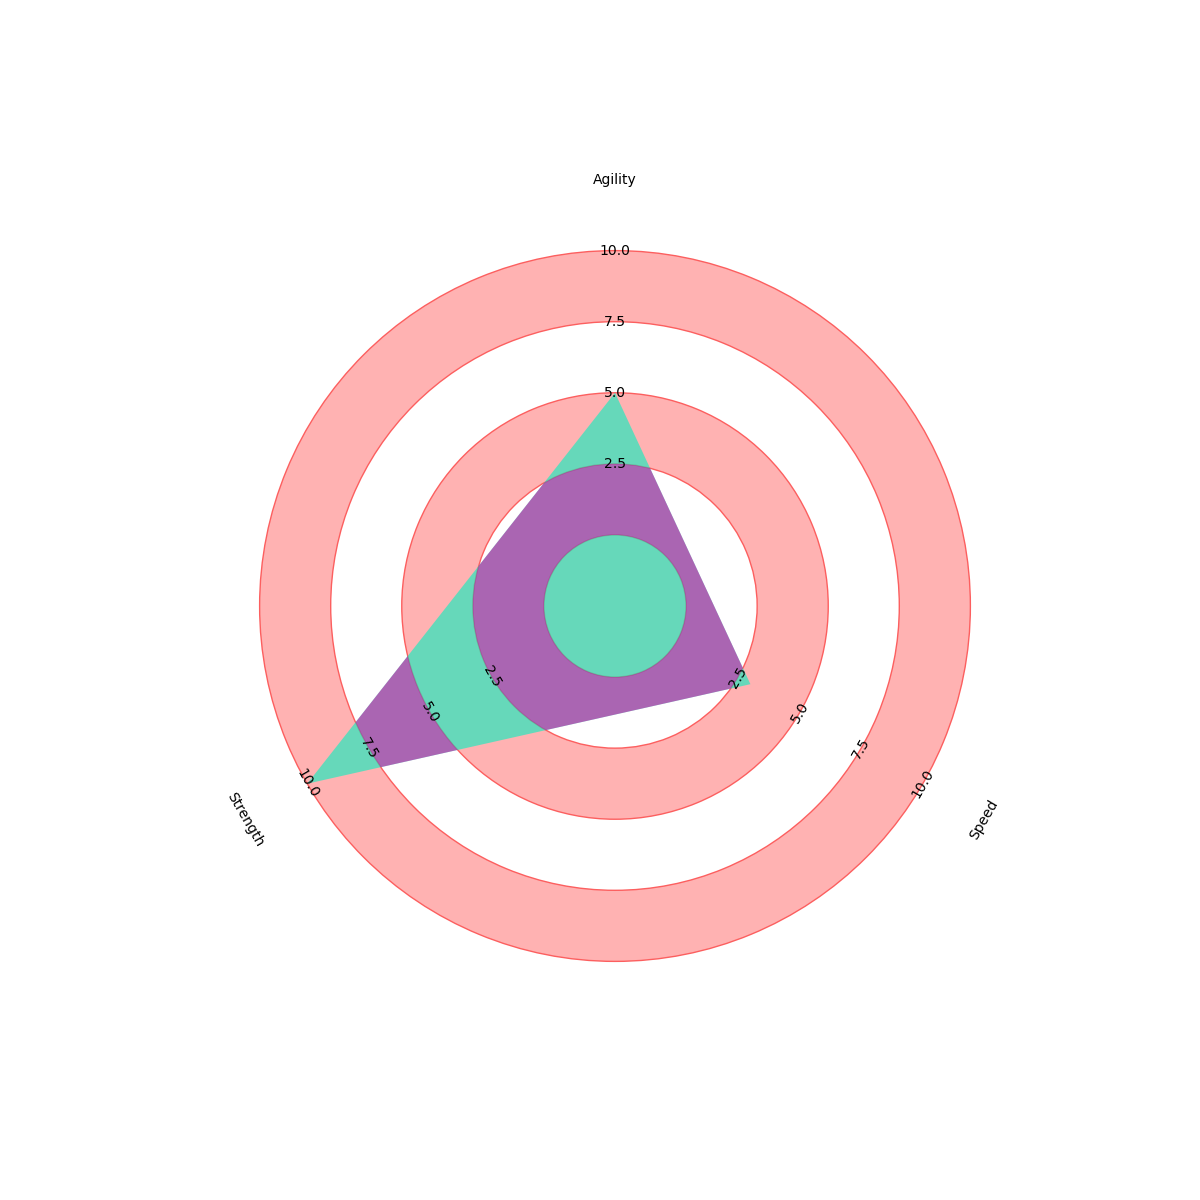
# plot a basic Radar
radar = Radar(params=['Agility', 'Speed', 'Strength'], min_range=[0, 0, 0],
max_range=[10, 10, 10])
fig, ax = radar.setup_axis()
rings_inner = radar.draw_circles(ax=ax, facecolor='#ffb2b2', edgecolor='#fc5f5f')
values = [5, 3, 10]
radar_poly, rings, vertices = radar.draw_radar(values, ax=ax,
kwargs_radar={'facecolor': '#00f2c1', 'alpha': 0.6},
kwargs_rings={'facecolor': '#d80499', 'alpha': 0.6})
range_labels = radar.draw_range_labels(ax=ax)
param_labels = radar.draw_param_labels(ax=ax)
plt.show() # If you are using a Jupyter notebook you do not need this line
Total running time of the script: (0 minutes 0.334 seconds)