Note
Go to the end to download the full example code.
Basic Pizza Plot (Percentiles)
Author: slothfulwave612
mplsoccer,py_pizzamodule helps one to plot pizza charts in a few lines of code.The design idea is inspired by Tom Worville, Football Slices and Soma Zero FC
We have re-written Soumyajit Bose’s pizza chart code to enable greater customisation.
Here we will show some examples of how to use mplsoccer to plot pizza-charts.
from urllib.request import urlopen

import matplotlib.pyplot as plt
from PIL import Image

from mplsoccer import PyPizza, add_image, FontManager
Load some fonts
We will use mplsoccer’s FontManager to load some fonts from Google Fonts. We borrowed the FontManager from the excellent ridge_map library.
font_normal = FontManager('https://raw.githubusercontent.com/googlefonts/roboto/main/'
                          'src/hinted/Roboto-Regular.ttf')
font_italic = FontManager('https://raw.githubusercontent.com/googlefonts/roboto/main/'
                          'src/hinted/Roboto-Italic.ttf')
font_bold = FontManager('https://raw.githubusercontent.com/google/fonts/main/apache/robotoslab/'
                        'RobotoSlab[wght].ttf')
Load Image
Load a cropped image of Robert Lewandowski.
URL = "https://raw.githubusercontent.com/andrewRowlinson/mplsoccer-assets/main/lewa_cropped.png"
lewa_cropped = Image.open(urlopen(URL))
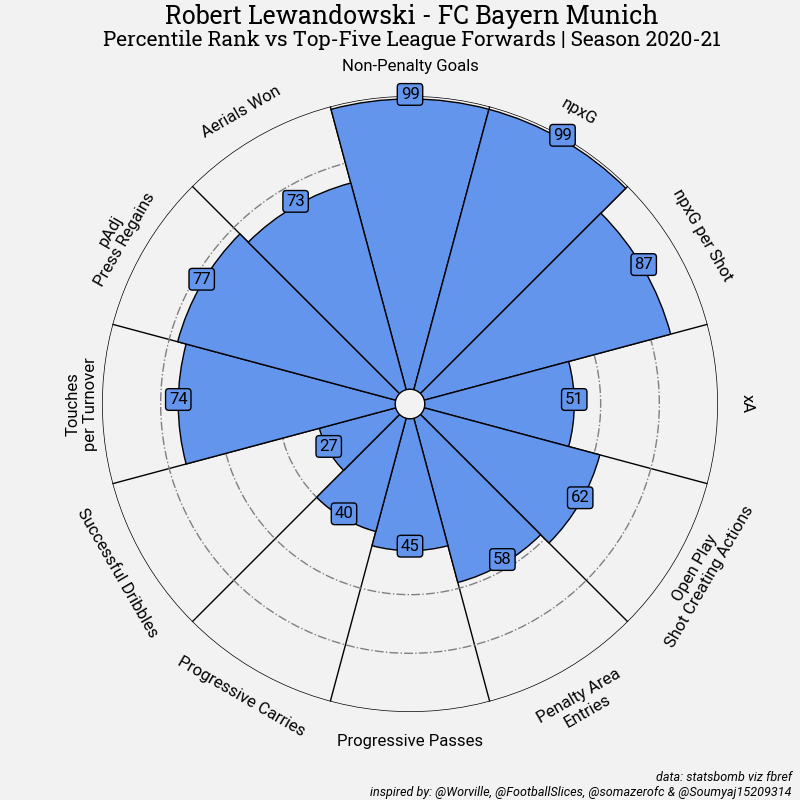
Plotting A Simple Pizza-Plot
To plot we need a parameter list and corresponding values list.
# parameter list
params = [
    "Non-Penalty Goals", "npxG", "npxG per Shot", "xA", "Open Play\nShot Creating Actions",
    "\nPenalty Area\nEntries", "Progressive Passes", "Progressive Carries",
    "Successful Dribbles", "\nTouches\nper Turnover", "pAdj\nPress Regains", "Aerials Won"
]

# values for corresponding parameters
# The values are taken from the excellent fbref website (supplied by StatsBomb)
values = [99, 99, 87, 51, 62, 58, 45, 40, 27, 74, 77, 73]

# instantiate PyPizza class
baker = PyPizza(
    params=params,                  # list of parameters
    straight_line_color="#000000",  # color for straight lines
    straight_line_lw=1,             # linewidth for straight lines
    last_circle_lw=1,               # linewidth of last circle
    other_circle_lw=1,              # linewidth for other circles
    other_circle_ls="-."            # linestyle for other circles
)

# plot pizza
fig, ax = baker.make_pizza(
    values,              # list of values
    figsize=(8, 8),      # adjust figsize according to your need
    param_location=110,  # where the parameters will be added
    kwargs_slices=dict(
        facecolor="cornflowerblue", edgecolor="#000000",
        zorder=2, linewidth=1
    ),                   # values to be used when plotting slices
    kwargs_params=dict(
        color="#000000", fontsize=12,
        fontproperties=font_normal.prop, va="center"
    ),                   # values to be used when adding parameter
    kwargs_values=dict(
        color="#000000", fontsize=12,
        fontproperties=font_normal.prop, zorder=3,
        bbox=dict(
            edgecolor="#000000", facecolor="cornflowerblue",
            boxstyle="round,pad=0.2", lw=1
        )
    )                    # values to be used when adding parameter-values
)

# add title
fig.text(
    0.515, 0.97, "Robert Lewandowski - FC Bayern Munich", size=18,
    ha="center", fontproperties=font_bold.prop, color="#000000"
)

# add subtitle
fig.text(
    0.515, 0.942,
    "Percentile Rank vs Top-Five League Forwards | Season 2020-21",
    size=15,
    ha="center", fontproperties=font_bold.prop, color="#000000"
)

# add credits
CREDIT_1 = "data: statsbomb viz fbref"
CREDIT_2 = "inspired by: @Worville, @FootballSlices, @somazerofc & @Soumyaj15209314"

fig.text(
    0.99, 0.005, f"{CREDIT_1}\n{CREDIT_2}", size=9,
    fontproperties=font_italic.prop, color="#000000",
    ha="right"
)

plt.show()
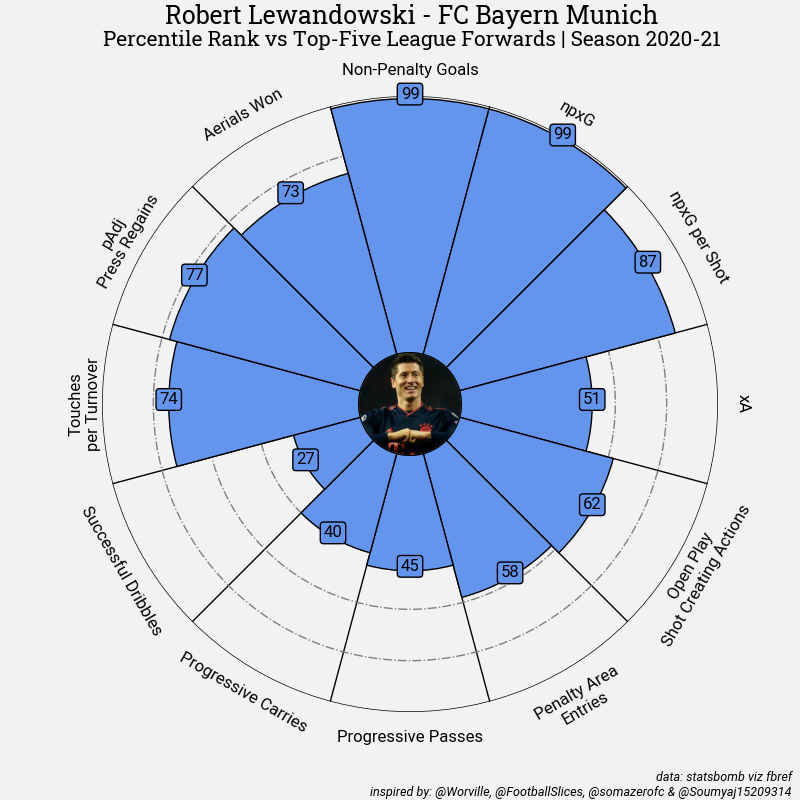
Adding Image
One can add image to the pizza plot. The process is like this: first increase the size of the
center circle by using inner_circle_size argument inside PyPizza
and then using add_image method to plot the image at the center.
Hack: You can use Image-Online.co to crop a circle in image online and then use that image for plotting.
# instantiate PyPizza class
baker = PyPizza(
    params=params,                  # list of params
    straight_line_color="#000000",  # color for straight lines
    straight_line_lw=1,             # linewidth for straight lines
    last_circle_lw=1,               # linewidth of last circle
    other_circle_lw=1,              # linewidth for other circles
    other_circle_ls="-.",           # linestyle for other circles
    inner_circle_size=20            # increase the circle size
)

# plot pizza
fig, ax = baker.make_pizza(
    values,              # list of values
    figsize=(8, 8),      # adjust figsize according to your need
    param_location=110,  # where the parameters will be added
    kwargs_slices=dict(
        facecolor="cornflowerblue", edgecolor="#000000",
        zorder=2, linewidth=1
    ),                   # values to be used when plotting slices
    kwargs_params=dict(
        color="#000000", fontsize=12,
        fontproperties=font_normal.prop, va="center"
    ),                   # values to be used when adding parameter
    kwargs_values=dict(
        color="#000000", fontsize=12,
        fontproperties=font_normal.prop, zorder=3,
        bbox=dict(
            edgecolor="#000000", facecolor="cornflowerblue",
            boxstyle="round,pad=0.2", lw=1
        )
    )                    # values to be used when adding parameter-values
)

# add title
fig.text(
    0.515, 0.97, "Robert Lewandowski - FC Bayern Munich", size=18,
    ha="center", fontproperties=font_bold.prop, color="#000000"
)

# add subtitle
fig.text(
    0.515, 0.942,
    "Percentile Rank vs Top-Five League Forwards | Season 2020-21",
    size=15,
    ha="center", fontproperties=font_bold.prop, color="#000000"
)

# add credits
CREDIT_1 = "data: statsbomb viz fbref"
CREDIT_2 = "inspired by: @Worville, @FootballSlices, @somazerofc & @Soumyaj15209314"

fig.text(
    0.99, 0.005, f"{CREDIT_1}\n{CREDIT_2}", size=9,
    fontproperties=font_italic.prop, color="#000000",
    ha="right"
)

# add image
ax_image = add_image(
    lewa_cropped, fig, left=0.4478, bottom=0.4315, width=0.13, height=0.127
)   # these values might differ when you are plotting

plt.show()
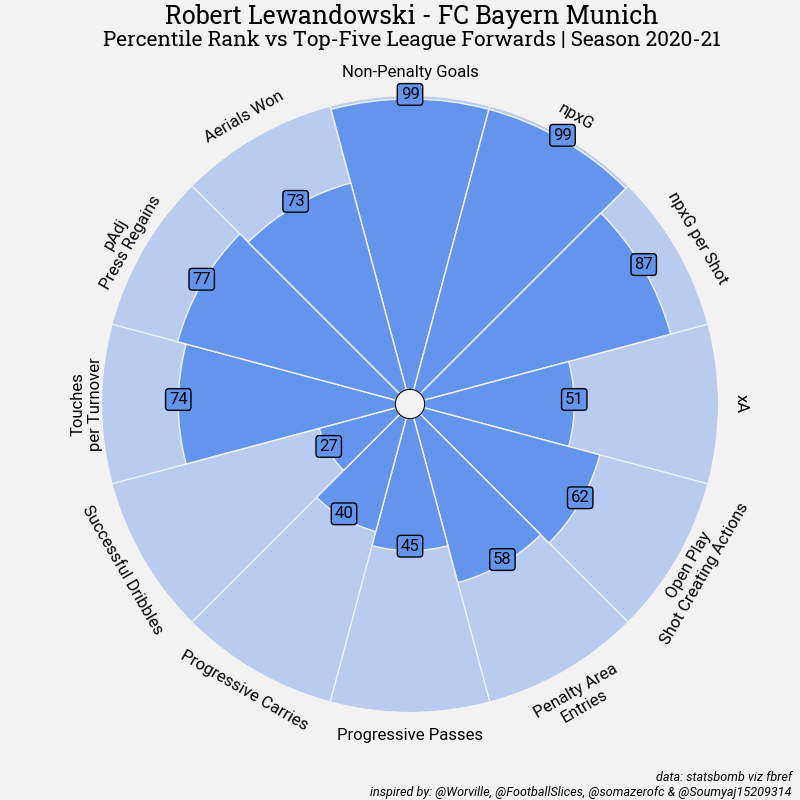
Adding Colors To Blank Spaces
One can even add colors to blank spaces, color_blank_space
is used for specifying the colors. There are two options that users can use.
If color_blank_space="same" is passed then the slice-color with lower alpha
value will be used to color the blank space. If a list of color is passed to
color_blank_space then those colors will be used. The user can set the alpha
for blank-space using blank_alpha argument.
# instantiate PyPizza class
baker = PyPizza(
    params=params,                  # list of parameters
    straight_line_color="#F2F2F2",  # color for straight lines
    straight_line_lw=1,             # linewidth for straight lines
    last_circle_lw=0,               # linewidth of last circle
    other_circle_lw=0,              # linewidth for other circles
)

# plot pizza
fig, ax = baker.make_pizza(
    values,                     # list of values
    figsize=(8, 8),             # adjust figsize according to your need
    color_blank_space="same",   # use same color to fill blank space
    blank_alpha=0.4,            # alpha for blank-space colors
    kwargs_slices=dict(
        facecolor="cornflowerblue", edgecolor="#F2F2F2",
        zorder=2, linewidth=1
    ),                          # values to be used when plotting slices
    kwargs_params=dict(
        color="#000000", fontsize=12,
        fontproperties=font_normal.prop, va="center"
    ),                          # values to be used when adding parameter
    kwargs_values=dict(
        color="#000000", fontsize=12,
        fontproperties=font_normal.prop, zorder=3,
        bbox=dict(
            edgecolor="#000000", facecolor="cornflowerblue",
            boxstyle="round,pad=0.2", lw=1
        )
    )                           # values to be used when adding parameter-values
)

# add title
fig.text(
    0.515, 0.97, "Robert Lewandowski - FC Bayern Munich", size=18,
    ha="center", fontproperties=font_bold.prop, color="#000000"
)

# add subtitle
fig.text(
    0.515, 0.942,
    "Percentile Rank vs Top-Five League Forwards | Season 2020-21",
    size=15,
    ha="center", fontproperties=font_bold.prop, color="#000000"
)

# add credits
CREDIT_1 = "data: statsbomb viz fbref"
CREDIT_2 = "inspired by: @Worville, @FootballSlices, @somazerofc & @Soumyaj15209314"

fig.text(
    0.99, 0.005, f"{CREDIT_1}\n{CREDIT_2}", size=9,
    fontproperties=font_italic.prop, color="#000000",
    ha="right"
)

plt.show()
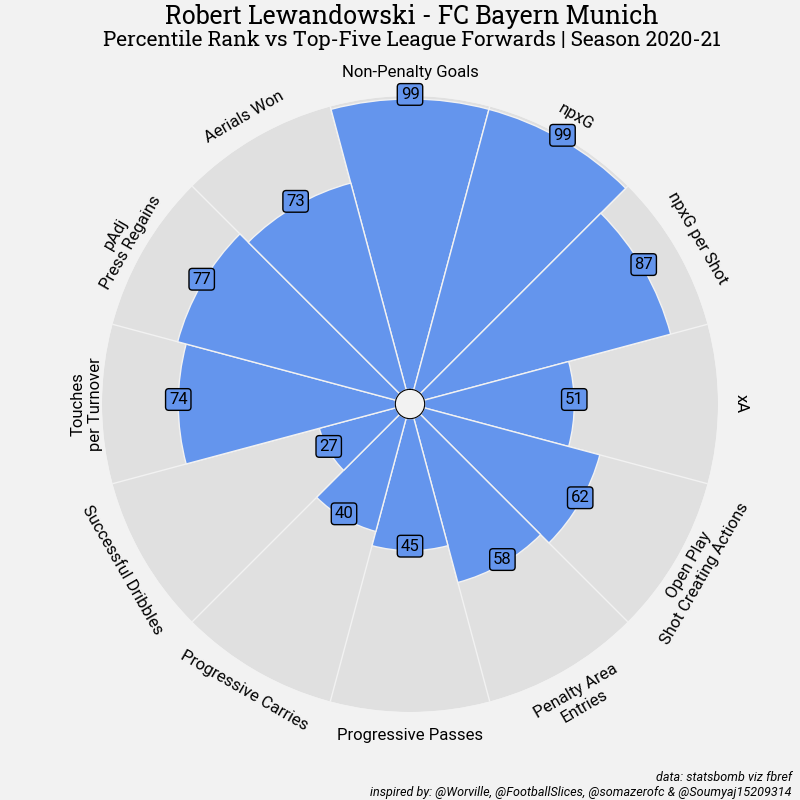
Adding Colors To Blank Spaces (2)
Here we will pass a list of color to fill the blank spaces.
# instantiate PyPizza class
baker = PyPizza(
    params=params,                  # list of parameters
    straight_line_color="#F2F2F2",  # color for straight lines
    straight_line_lw=1,             # linewidth for straight lines
    last_circle_lw=0,               # linewidth of last circle
    other_circle_lw=0,              # linewidth for other circles
)

# plot pizza
fig, ax = baker.make_pizza(
    values,                                      # list of values
    figsize=(8, 8),                              # adjust figsize according to your need
    color_blank_space=["#C5C5C5"]*len(params),   # use same color to fill blank space
    blank_alpha=0.4,                             # alpha for blank-space colors
    kwargs_slices=dict(
        facecolor="cornflowerblue", edgecolor="#F2F2F2",
        zorder=2, linewidth=1
    ),                                           # values to be used when plotting slices
    kwargs_params=dict(
        color="#000000", fontsize=12,
        fontproperties=font_normal.prop, va="center"
    ),                                           # values to be used when adding parameter
    kwargs_values=dict(
        color="#000000", fontsize=12,
        fontproperties=font_normal.prop, zorder=3,
        bbox=dict(
            edgecolor="#000000", facecolor="cornflowerblue",
            boxstyle="round,pad=0.2", lw=1
        )
    )                                            # values to be used when adding parameter-values
)

# add title
fig.text(
    0.515, 0.97, "Robert Lewandowski - FC Bayern Munich", size=18,
    ha="center", fontproperties=font_bold.prop, color="#000000"
)

# add subtitle
fig.text(
    0.515, 0.942,
    "Percentile Rank vs Top-Five League Forwards | Season 2020-21",
    size=15,
    ha="center", fontproperties=font_bold.prop, color="#000000"
)

# add credits
CREDIT_1 = "data: statsbomb viz fbref"
CREDIT_2 = "inspired by: @Worville, @FootballSlices, @somazerofc & @Soumyaj15209314"

fig.text(
    0.99, 0.005, f"{CREDIT_1}\n{CREDIT_2}", size=9,
    fontproperties=font_italic.prop, color="#000000",
    ha="right"
)

plt.show()
Using Alternative Text Values
Sometimes you want to display actual values on the pizza chart while still
using percentiles for the visual representation. The alt_text_values
parameter allows you to specify different values to display on the chart
while keeping the percentile calculations for the slice sizes.
# Let's create an example where we show actual match statistics
# but calculate percentiles for the visual representation

# parameter list (same as before)
params = [
    "Non-Penalty Goals", "npxG", "npxG per Shot", "xA", "Open Play\nShot Creating Actions",
    "\nPenalty Area\nEntries", "Progressive Passes", "Progressive Carries",
    "Successful Dribbles", "\nTouches\nper Turnover", "pAdj\nPress Regains", "Aerials Won"
]

# percentile values for visualization (slice sizes)
percentile_values = [99, 99, 87, 51, 62, 58, 45, 40, 27, 74, 77, 73]

# actual raw values to display on the chart
actual_values = [
    41, 39.2, 0.31, 7.8, 3.2,
    4.1, 2.8, 1.5, 0.9,
    13.2, 9.1, 3.8
]

# instantiate PyPizza class
baker = PyPizza(
    params=params,                  # list of parameters
    straight_line_color="#F2F2F2",  # color for straight lines
    straight_line_lw=1,             # linewidth for straight lines
    last_circle_lw=0,               # linewidth of last circle
    other_circle_lw=0,              # linewidth for other circles
)

# plot pizza with alternative text values
fig, ax = baker.make_pizza(
    percentile_values,               # list of percentile values for slice sizes
    figsize=(8, 8),                  # adjust figsize according to your need
    alt_text_values=actual_values,   # actual values to display on chart
    color_blank_space="same",        # use same color to fill blank space
    blank_alpha=0.4,                 # alpha for blank-space colors
    kwargs_slices=dict(
        facecolor="lightcoral", edgecolor="#F2F2F2",
        zorder=2, linewidth=1
    ),                               # values to be used when plotting slices
    kwargs_params=dict(
        color="#000000", fontsize=12,
        fontproperties=font_normal.prop, va="center"
    ),                               # values to be used when adding parameter
    kwargs_values=dict(
        color="#000000", fontsize=11,
        fontproperties=font_normal.prop, zorder=3,
        bbox=dict(
            edgecolor="#000000", facecolor="lightcoral",
            boxstyle="round,pad=0.2", lw=1
        )
    )                                # values to be used when adding parameter-values
)

# add title
fig.text(
    0.515, 0.97, "Robert Lewandowski - FC Bayern Munich", size=18,
    ha="center", fontproperties=font_bold.prop, color="#000000"
)

# add subtitle
fig.text(
    0.515, 0.942,
    "Actual Values Displayed | Percentile Rank vs Top-Five League Forwards | Season 2020-21",
    size=14,
    ha="center", fontproperties=font_bold.prop, color="#000000"
)

# add credits
CREDIT_1 = "data: statsbomb viz fbref"
CREDIT_2 = "inspired by: @Worville, @FootballSlices, @somazerofc & @Soumyaj15209314"

fig.text(
    0.99, 0.005, f"{CREDIT_1}\n{CREDIT_2}", size=9,
    fontproperties=font_italic.prop, color="#000000",
    ha="right"
)

plt.show()

Total running time of the script: (0 minutes 0.604 seconds)