Note
Go to the end to download the full example code.
Photos
This example shows how to plot photos in your charts.
from urllib.request import urlopen, Request

import matplotlib.pyplot as plt
from PIL import Image

from mplsoccer import Pitch, add_image

plt.style.use('dark_background')
Load an image of Messi
# load the image
IMAGE_URL = 'https://upload.wikimedia.org/wikipedia/commons/b/b8/Messi_vs_Nigeria_2018.jpg'
request = Request(IMAGE_URL)
request.add_header('User-Agent', 'mplsoccerdocs (https://mplsoccer.rtfd.io)')
image = Image.open(urlopen(request))
Inset image
You can use ax_image to create an inset_axes on a pitch and then plot an image.
pitch = Pitch(line_zorder=2)
fig, ax = pitch.draw(figsize=(16, 9), tight_layout=False)
ax_image = pitch.inset_image(40, 60, image, height=20, ax=ax)
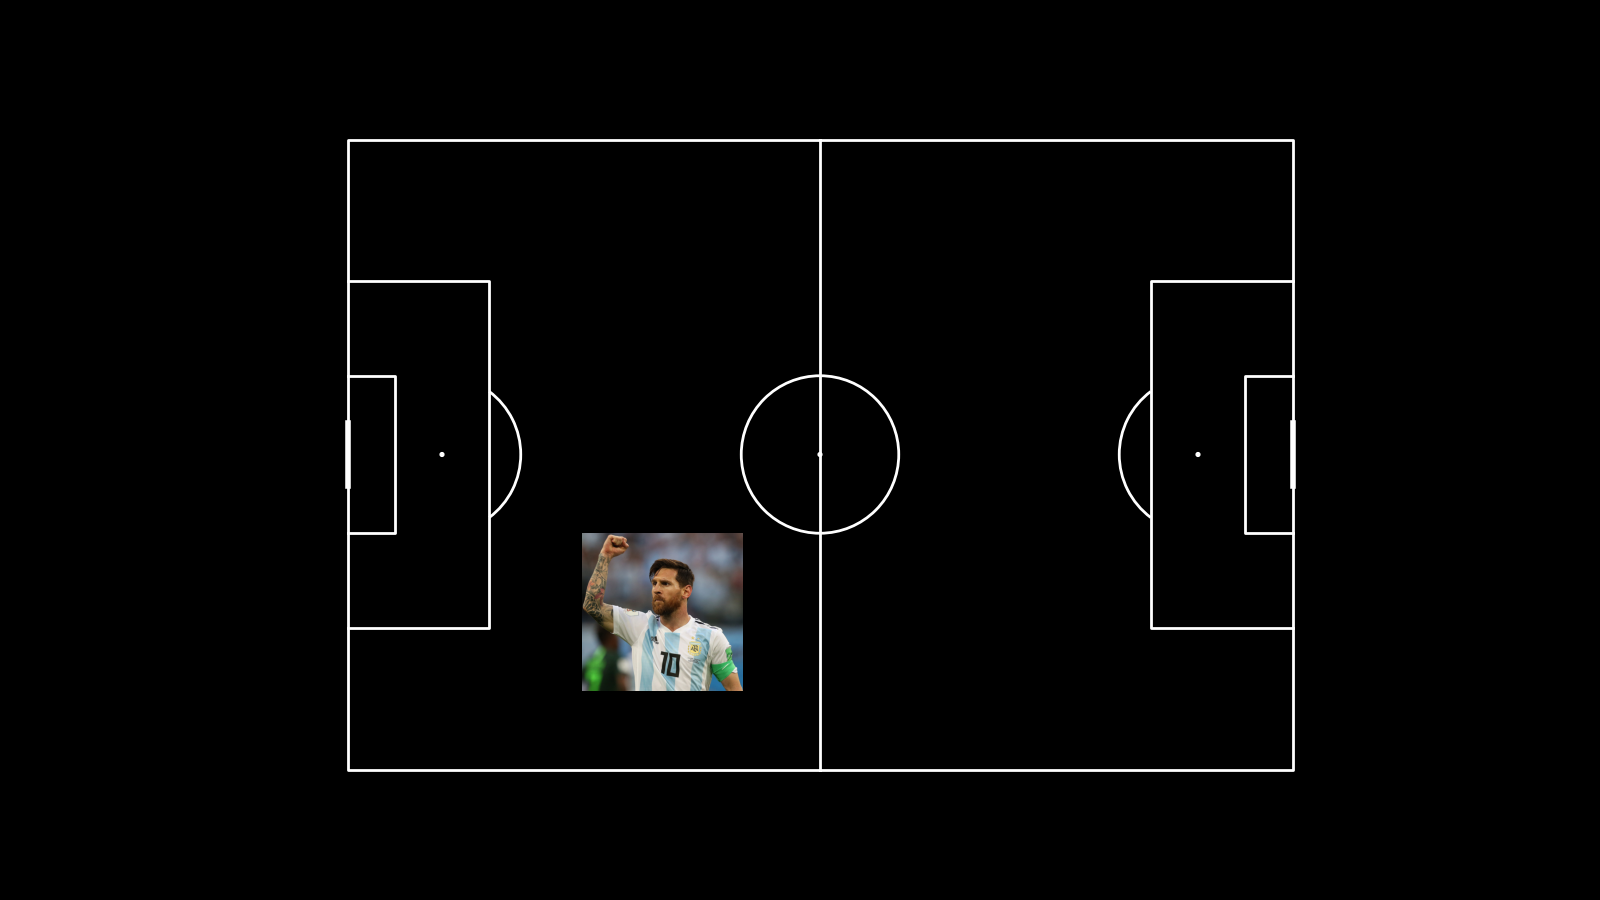
Photo from: https://en.wikipedia.org/wiki/Lionel_Messi#/media/File:Messi_vs_Nigeria_2018.jpg; License: https://creativecommons.org/licenses/by-sa/3.0/; Creator: Кирилл Венедиктов
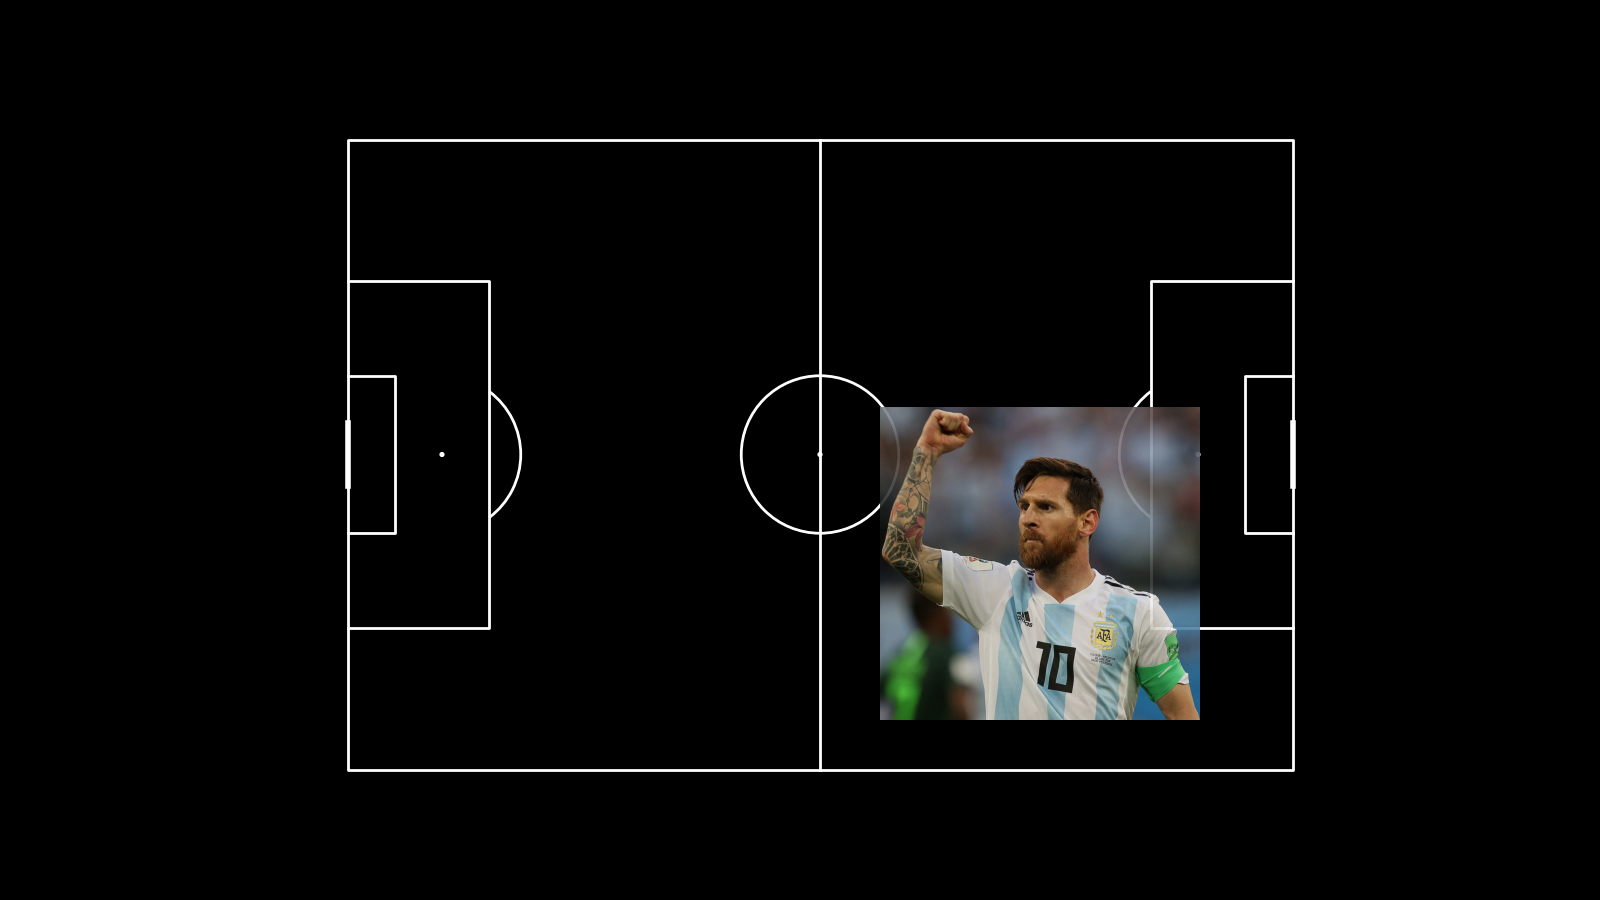
Plotting an image over a pitch
You can also use add_image, which uses figure coordinates instead of the pitch coordinates
for placing the axes.
# draw the pitch
pitch = Pitch(line_zorder=2)
fig, ax = pitch.draw(figsize=(16, 9), tight_layout=False)

# add an image
ax_image = add_image(image, fig, left=0.55, bottom=0.2, width=0.2,
                     alpha=0.9, interpolation='hanning')
More control over the images and axis
For more control over where the images are placed,
you can create a blank figure with plt.figure()
and then use Figure.add_axes() to add seperate axes for each of the plot elements.
# setup a blank figure
figsize = (16, 9)
fig_aspect = figsize[0] / figsize[1]
fig = plt.figure(figsize=figsize)

# setup a Pitch object
pitch = Pitch(pad_bottom=0.5, pad_top=0.5, pad_left=0.5, pad_right=0.5, line_zorder=2)

# we are going to add an axis for the pitch
# the width will be 65% (0.65) of the total figure
# we then calculate the pitch display height and draw the pitch on the new axis
PITCH_DISPLAY_WIDTH = 0.65
pitch_display_height = PITCH_DISPLAY_WIDTH / pitch.ax_aspect * fig_aspect
ax1 = fig.add_axes((0.05,  # 5% in from the left of the image
                    0.05,  # 5% in from the bottom of the image
                    PITCH_DISPLAY_WIDTH, pitch_display_height))
pitch.draw(ax=ax1, tight_layout=False)

# we are also going to add the Messi image to the top of the figure as a new axis
# but this time the width will be 8% of the figure
ax2 = add_image(image, fig, left=0.054, bottom=0.84, width=0.08, interpolation='hanning')

# and the Messi image to the bottom right of the figure on a new axis
# but this time the width will be 20% of the figure
ax3 = add_image(image, fig, left=0.75, bottom=0.054, width=0.2, interpolation='hanning')

# add a title
title = fig.suptitle("Messi's greatest hits", x=0.42, y=0.9, va='center', ha='center', fontsize=60)
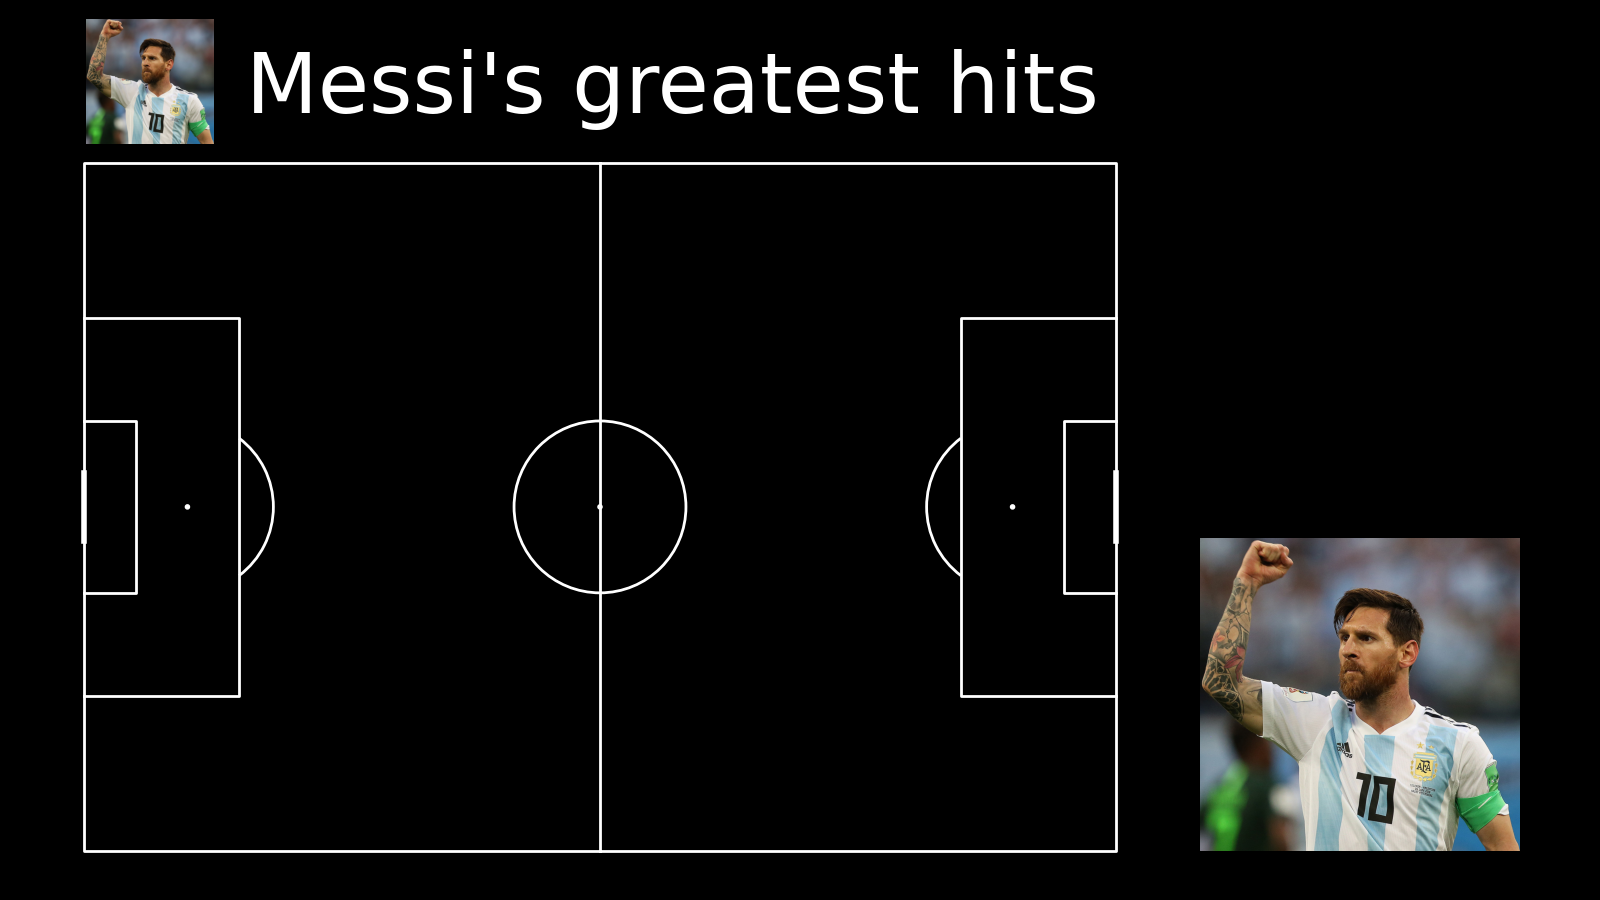
Photo from: https://en.wikipedia.org/wiki/Lionel_Messi#/media/File:Messi_vs_Nigeria_2018.jpg; License: https://creativecommons.org/licenses/by-sa/3.0/; Creator: Кирилл Венедиктов
plt.show() # If you are using a Jupyter notebook you do not need this line
Total running time of the script: (0 minutes 0.543 seconds)