Note
Go to the end to download the full example code.
Standardize data
This example converts data from one data provider to another, based on the excellent ggsoccer (R language).
The conversion maintains the relevant position to the pitch markings, so if a shot is half-way between the penalty spot and the penalty-area box, it stays that way after conversion. During conversion, coordinates outside the pitch side-lines are clipped to the pitch shape, while missing values are maintained.
import pandas as pd
import numpy as np
import matplotlib.pyplot as plt
from kloppy import wyscout
from adjustText import adjust_text
from highlight_text import ax_text

from mplsoccer import VerticalPitch, Standardizer, FontManager, Sbopen
First, let’s demonstate converting statsbomb coordinates to tracab coordinates.
# here we show how to convert StatsBomb to tracab coordinates
# as the length and width of a tracab pitch varies we have to supply these too
statsbomb_to_tracab = Standardizer(pitch_from='statsbomb',
                                   pitch_to='tracab', length_to=105, width_to=68)
x_tracab, y_tracab = statsbomb_to_tracab.transform(x=[20, 50], y=[0, 30])
We convert data like this because most providers of event data
(opta, wyscout, and statsbomb) fix the coordinates inside the penalty area
regardless of the pitch size, while the rest of the pitch stretches to the side-lines.
For example, Liverpool’s ground, Anfield, is 68 meters wide and Fulham’s ground, Craven Cottage, is 65 meters wide. With the fixed pitch coordinates, the extra three meters of space squeezes between the penalty area and the pitch side-lines.
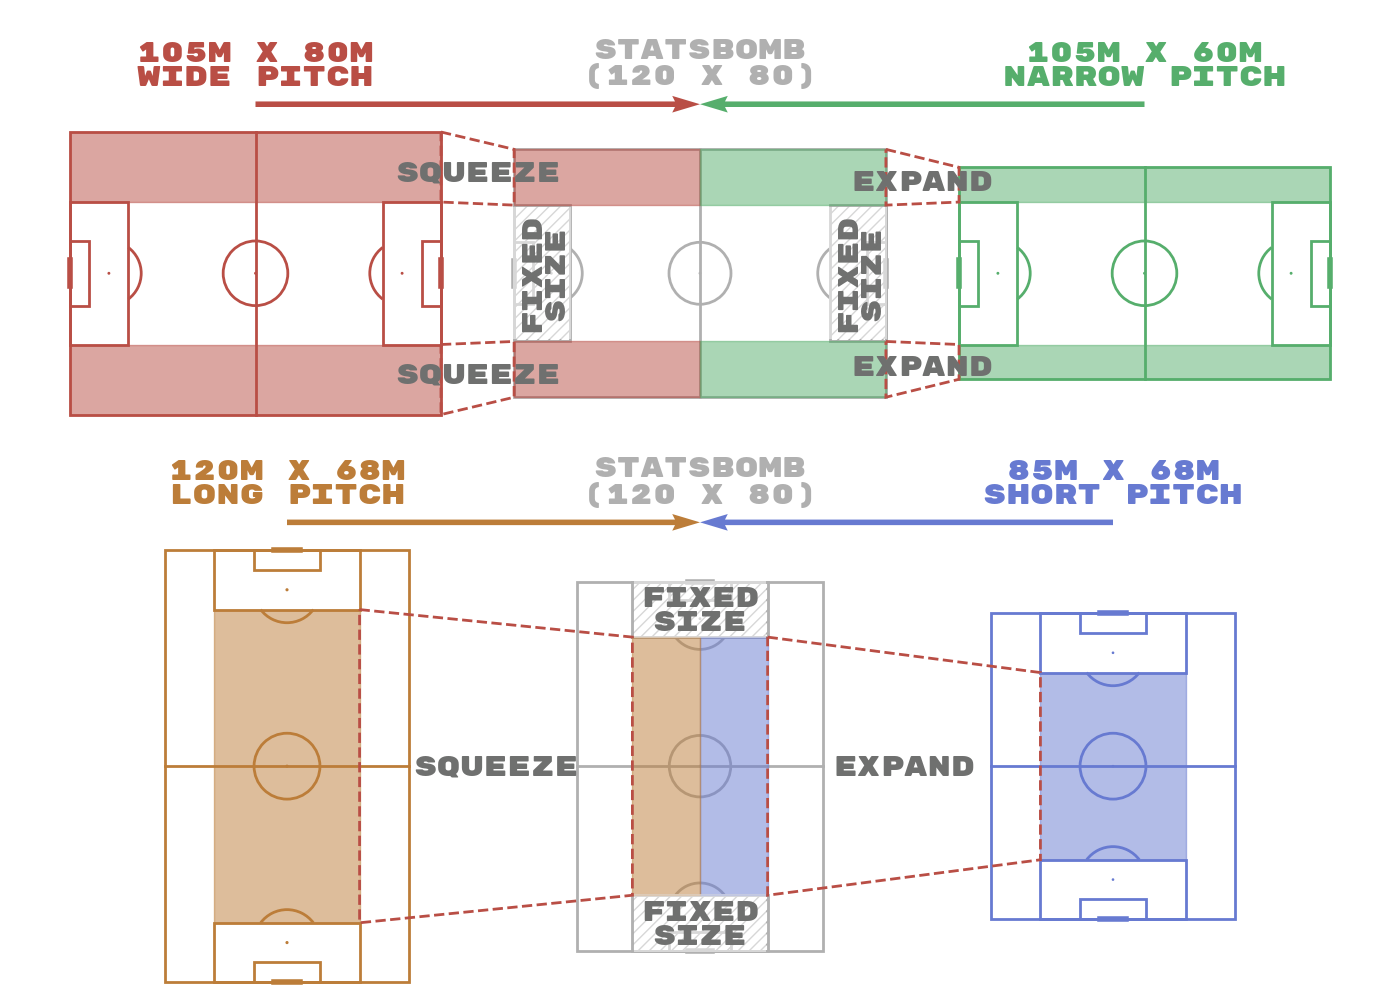
The following pitch markings are used in the conversion: the pitch side-lines, six-yard-box, goal-posts, penalty spot, penalty area and the centre-line.
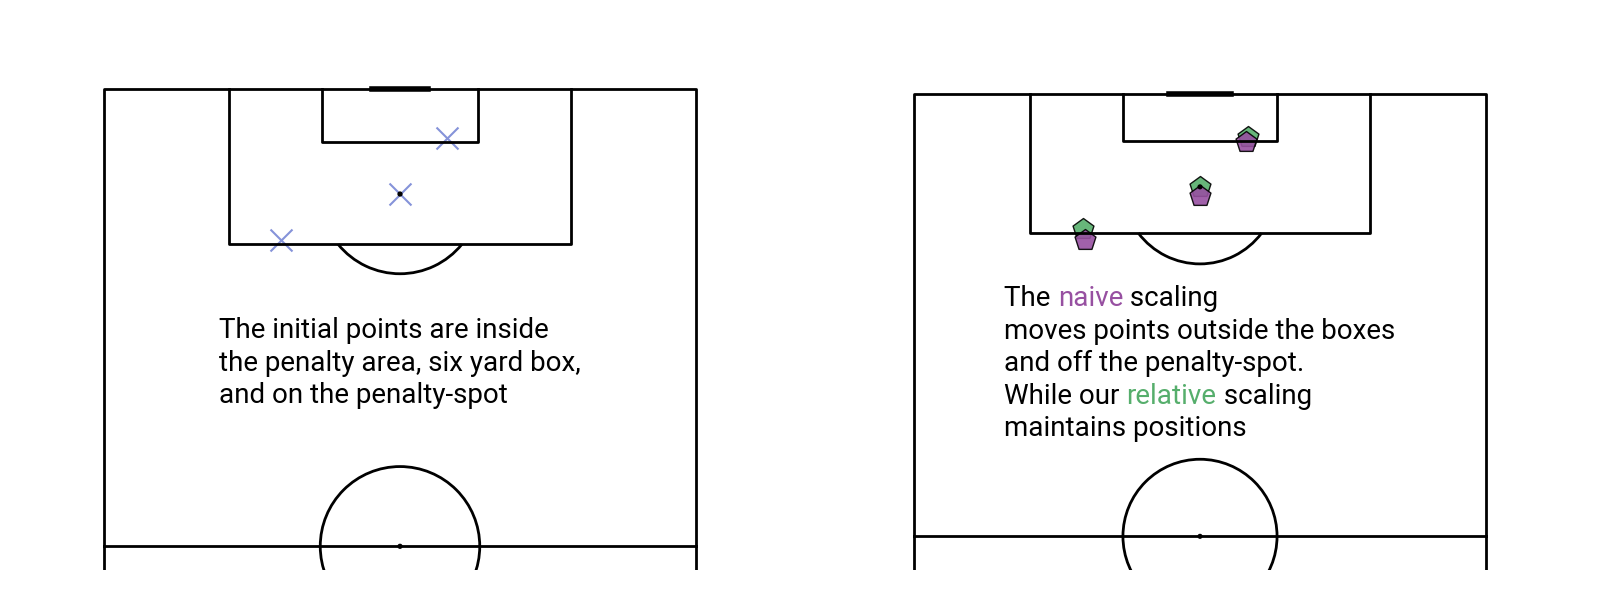
Here is an example of how naive scaling can lead to erroneous results. Naive scaling of points would divide by the original pitch dimensions and multiply by the new pitch dimensions. This leads to occasions where events can move from within the penalty area to outside the penalty area. For events such as fouls this does not make sense as the punishment for fouling changes outside the penalty area.
# our points
x = np.array([83.5, 94.6, 88.5])
y = np.array([70, 42, 50])

# naive scaling
x_naive = x / 100 * 105
y_naive = y / 100 * 68

# our mplsoccer scaling
opta_to_custom = Standardizer(pitch_from='opta',
                              pitch_to='custom', length_to=105, width_to=68)

x_relative, y_relative = opta_to_custom.transform(x, y)

# plotting to show that events can move from their pitch markings
# without relative scaling to the pitch markings

# first setup the figure
FIGWIDTH = 16
FIGHEIGHT = 6
fig = plt.figure(figsize=(FIGWIDTH, FIGHEIGHT))

opta_pitch = VerticalPitch(pitch_type='opta', line_color='black',
                           half=True, line_zorder=3)
ax_opta = fig.add_axes((0.05, 0.05, 0.4, 0.4 * FIGWIDTH/FIGHEIGHT / opta_pitch.ax_aspect))
opta_pitch.draw(ax=ax_opta)

custom_pitch = VerticalPitch(pitch_type='custom', line_color='black',
                             half=True, pitch_length=105,
                             pitch_width=68, line_zorder=3)
ax_custom = fig.add_axes((0.55, 0.05, 0.4, 0.4 * FIGWIDTH/FIGHEIGHT / custom_pitch.ax_aspect))
custom_pitch.draw(ax=ax_custom)

# draw the original event points
fm = FontManager()  # a mplsoccer fontmanager with the default Robotto font
opta_pitch.scatter(x, y, s=250, marker='x', alpha=0.8,
                   edgecolor='black', facecolor='#6778d0', ax=ax_opta)
TEXT = ('The initial points are inside\n'
        'the penalty area, six yard box,\n'
        'and on the penalty-spot')
_ = ax_text(50, 70, TEXT, va='center', ha='center', fontproperties=fm.prop,
            fontsize=20, ax=ax_opta)

# draw the scaled event points
custom_pitch.scatter(x_naive, y_naive, marker='p', alpha=0.9, facecolor='#9750a1', zorder=2.5,
                     edgecolor='black', s=250, ax=ax_custom)
custom_pitch.scatter(x_relative, y_relative, marker='p', alpha=0.9, facecolor='#56ae6c',
                     edgecolor='black', s=250, ax=ax_custom)
TEXT2 = ('The <naive> scaling\n'
         'moves points outside the boxes\n'
         'and off the penalty-spot.\n'
         'While our <relative> scaling\n'
         'maintains positions')
_ = ax_text(34, 73, TEXT2, va='center', ha='center', fontproperties=fm.prop,
            highlight_textprops=[{'color': '#9750a1'},
                                 {'color': '#56ae6c'}],
            fontsize=20, ax=ax_custom)
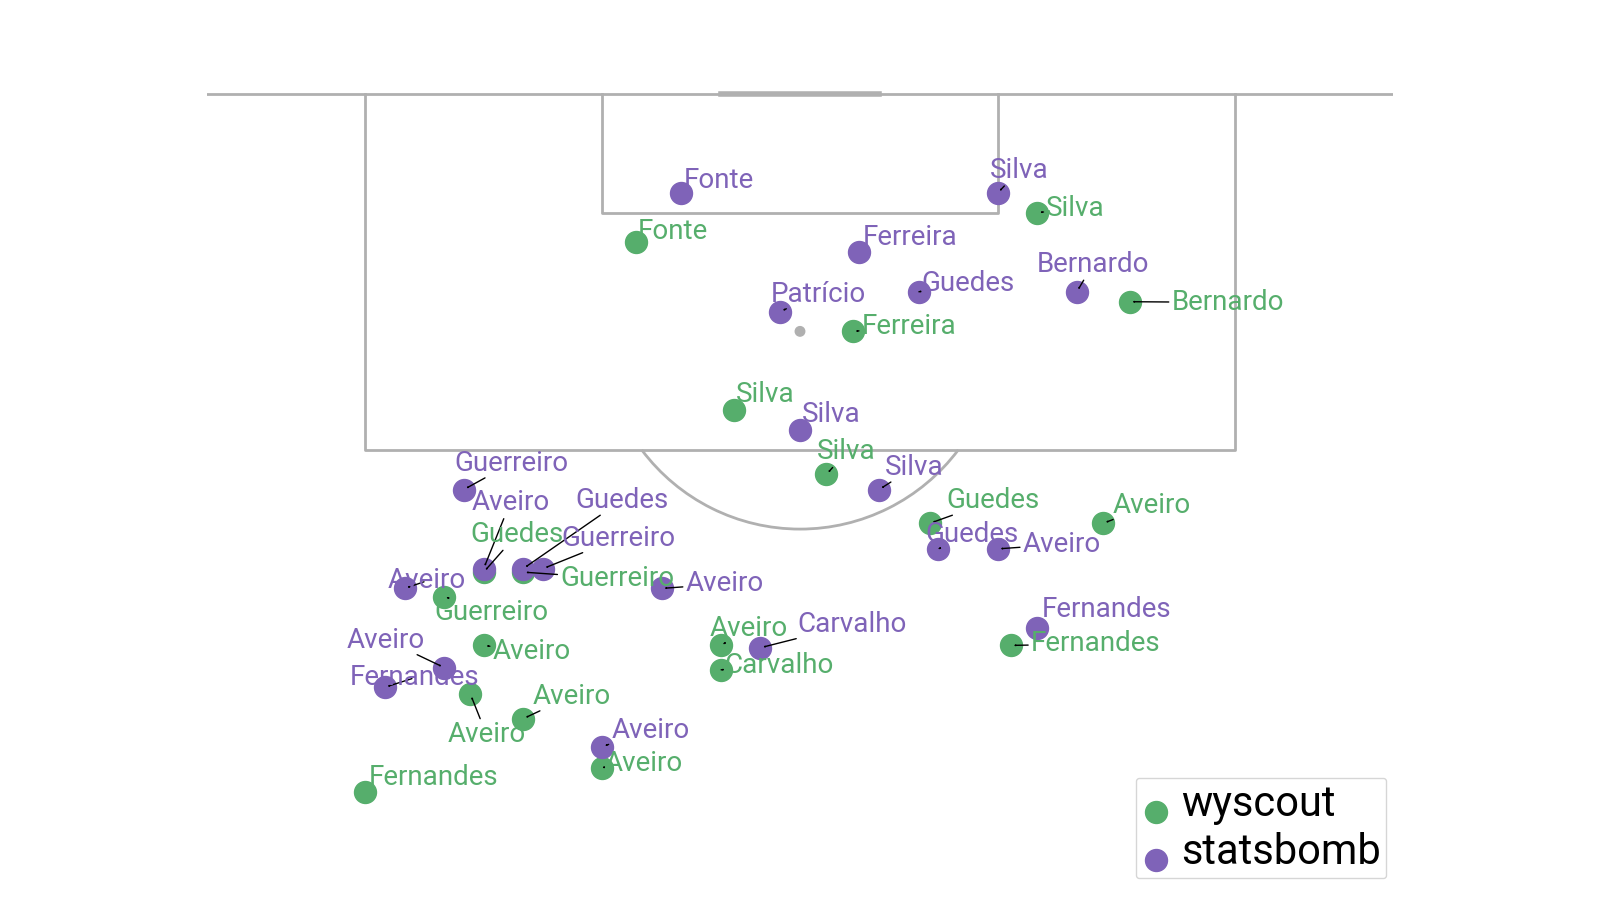
Get overlapping StatsBomb and Wyscout data
Here we will get the event data from both a Wyscout and StatsBomb game and standardize to the same coordinates to compare.
# Get the StatsBomb data
parser = Sbopen()
df_statsbomb = parser.event(7579)[0]  # events are the zero index

dataset = wyscout.load_open_data(match_id=2058002, coordinates='wyscout')
df_wyscout = dataset.to_df(
        '*',
        player_name=lambda event: str(event.player),
        team_name=lambda event: str(event.player.team),
    )
Standardize the Wyscout data to StatsBomb coordinates
You can use any of the supported pitches in the pitch_from/ pitch_to here.
They are currently: statsbomb, tracab, opta, wyscout, uefa,
metricasports, custom, skillcorner, impect, and secondspectrum.
If the pitch size varies (tracab, metricasports, custom,
skillcorner, secondspectrum)
then you also need to supply the relevant
length_from/ length_to or width_from/ width_to in meters.
# setup the Standardizer
wyscout_to_statsbomb = Standardizer(pitch_from='wyscout', pitch_to='statsbomb')
# transform the coordinates and save to the dataframe
x_std, y_std = wyscout_to_statsbomb.transform(df_wyscout.coordinates_x,
                                              df_wyscout.coordinates_y)
df_wyscout['coordinates_x'] = x_std
df_wyscout['coordinates_y'] = y_std
Add the last name to the dataframes
df_statsbomb['last_name'] = df_statsbomb.player_name.str.split(' ').str[-1]
df_wyscout['last_name'] = df_wyscout.player_name.str.split(' ').str[-1]
Plot the standardized data
pitch = VerticalPitch(pitch_type='statsbomb', half=True, pad_left=-10,
                      pad_right=-10, pad_bottom=-20)
fig, ax = pitch.draw(figsize=(16, 9))

# subset portugals shots for both data providers
mask_portugal_sb = df_statsbomb.team_name == 'Portugal'
mask_shot_sb = df_statsbomb.type_name == 'Shot'
mask_portugal_wyscout = df_wyscout.team_name == 'Portugal'
mask_shot_wyscout = df_wyscout.event_type == 'SHOT'
df_wyscout_portugal = df_wyscout[mask_shot_wyscout & mask_portugal_wyscout].copy()
df_statsbomb_portugal = df_statsbomb[mask_shot_sb & mask_portugal_sb].copy()

# plotting the shots as a scatter plot with a legend
pitch.scatter(df_wyscout_portugal.coordinates_x, df_wyscout_portugal.coordinates_y,
              ax=ax, color='#56ae6c', label='wyscout', s=250)
pitch.scatter(df_statsbomb_portugal.x, df_statsbomb_portugal.y,
              ax=ax, color='#7f63b8', label='statsbomb', s=250)

# plotting the text and using adjust text so it doesn't overlap
texts = []
for i in range(len(df_wyscout_portugal)):
    text = ax.text(df_wyscout_portugal['coordinates_y'].iloc[i],
                   df_wyscout_portugal['coordinates_x'].iloc[i],
                   df_wyscout_portugal['last_name'].iloc[i],
                   color='#56ae6c', fontsize=20, fontproperties=fm.prop)
    texts.append(text)

for i in range(len(df_statsbomb_portugal)):
    text = ax.text(df_statsbomb_portugal['y'].iloc[i],
                   df_statsbomb_portugal['x'].iloc[i],
                   df_statsbomb_portugal['last_name'].iloc[i],
                   color='#7f63b8', fontsize=20, fontproperties=fm.prop)
    texts.append(text)
adjust_text(texts, arrowprops=dict(arrowstyle='->', color='black'))

# adding a legend
legend = ax.legend(prop=fm.prop)
for text in legend.get_texts():
    text.set_fontsize(30)

# sphinx_gallery_thumbnail_path = 'gallery/pitch_plots/images/sphx_glr_plot_standardize_002.png'
Reverse the standardization
You can reverse the standardization with the reverse keyword.
x_std, y_std = wyscout_to_statsbomb.transform(df_wyscout.coordinates_x,
                                              df_wyscout.coordinates_y, reverse=True)
Standardize to an abritary shaped pitch
According to Wikipedia the Campo de fútbol de Vallecas stadium is 100 meters x 65 meters Let’s load StatsBomb data from a Rayo Vallecano home game versus Barcelona and convert to meters.
df_rayo_vallecano = parser.event(266653)[0]  # events are the zero index
statsbomb_to_custom = Standardizer(pitch_from='statsbomb',
                                   pitch_to='custom', length_to=100, width_to=65)

rayo_x_std, rayo_y_std = statsbomb_to_custom.transform(df_rayo_vallecano.x,
                                                       df_rayo_vallecano.y)
xend_std, yend_std = statsbomb_to_custom.transform(df_rayo_vallecano.end_x,
                                                   df_rayo_vallecano.end_y)

df_rayo_vallecano['x'] = rayo_x_std
df_rayo_vallecano['y'] = rayo_y_std
df_rayo_vallecano['end_x'] = xend_std
df_rayo_vallecano['end_y'] = yend_std
Now let’s calculate the distance in meters for the passes in the game And compare to pass distance given in the StatsBomb dataframe The calculated distances are shorter as the pitch is smaller than the standard pitch dimensions (105 meters X 68 meters).
# filter passes
df_rayo_vallecano_pass = df_rayo_vallecano[df_rayo_vallecano.type_name == 'Pass'].copy()
# calculate the average pass length
custom_pitch = VerticalPitch(pitch_type='custom', pitch_length=100, pitch_width=65)
angle, distance = custom_pitch.calculate_angle_and_distance(df_rayo_vallecano_pass.x,
                                                            df_rayo_vallecano_pass.y,
                                                            df_rayo_vallecano_pass.end_x,
                                                            df_rayo_vallecano_pass.end_y)
print('Calculated distance in meters')
print(pd.Series(distance).describe())
print('\nDistances in the StatsBomb data')
print((df_rayo_vallecano.pass_length * 0.9144).describe())  # note converted from yards to meters

plt.show()  # If you are using a Jupyter notebook you do not need this line
Calculated distance in meters
count    884.000000
mean      18.340904
std       12.169932
min        1.146450
25%        9.633855
50%       15.665898
75%       23.789170
max       75.848802
dtype: float64

Distances in the StatsBomb data
count    884.000000
mean      20.248167
std       13.364533
min        1.230199
25%       10.792629
50%       16.949844
75%       25.542135
max       84.580464
Name: pass_length, dtype: float64
Total running time of the script: (0 minutes 5.551 seconds)