Note
Go to the end to download the full example code.
Customize colormaps
This example shows how to use cmasher colormaps and also how to make a custom colormap (cmap) in Matplotlib. Colormaps are used to map from a value to a color in a chart.
import matplotlib.pyplot as plt
import numpy as np
import pandas as pd
from matplotlib.colors import LinearSegmentedColormap
import cmasher as cmr

from mplsoccer import VerticalPitch, Sbopen
from mplsoccer.utils import FontManager

# get data
parser = Sbopen()
match_files = [19789, 19794, 19805]
df = pd.concat([parser.event(file)[0] for file in match_files])  # 0 index is the event file

# filter chelsea pressure events
mask_chelsea_pressure = (df.team_name == 'Chelsea FCW') & (df.type_name == 'Pressure')
df = df.loc[mask_chelsea_pressure, ['x', 'y']]
/home/docs/checkouts/readthedocs.org/user_builds/mplsoccer/envs/latest/lib/python3.12/site-packages/colorspacious/comparison.py:11: SyntaxWarning: invalid escape sequence '\D'
  """Computes the :math:`\Delta E` distance between pairs of colors.
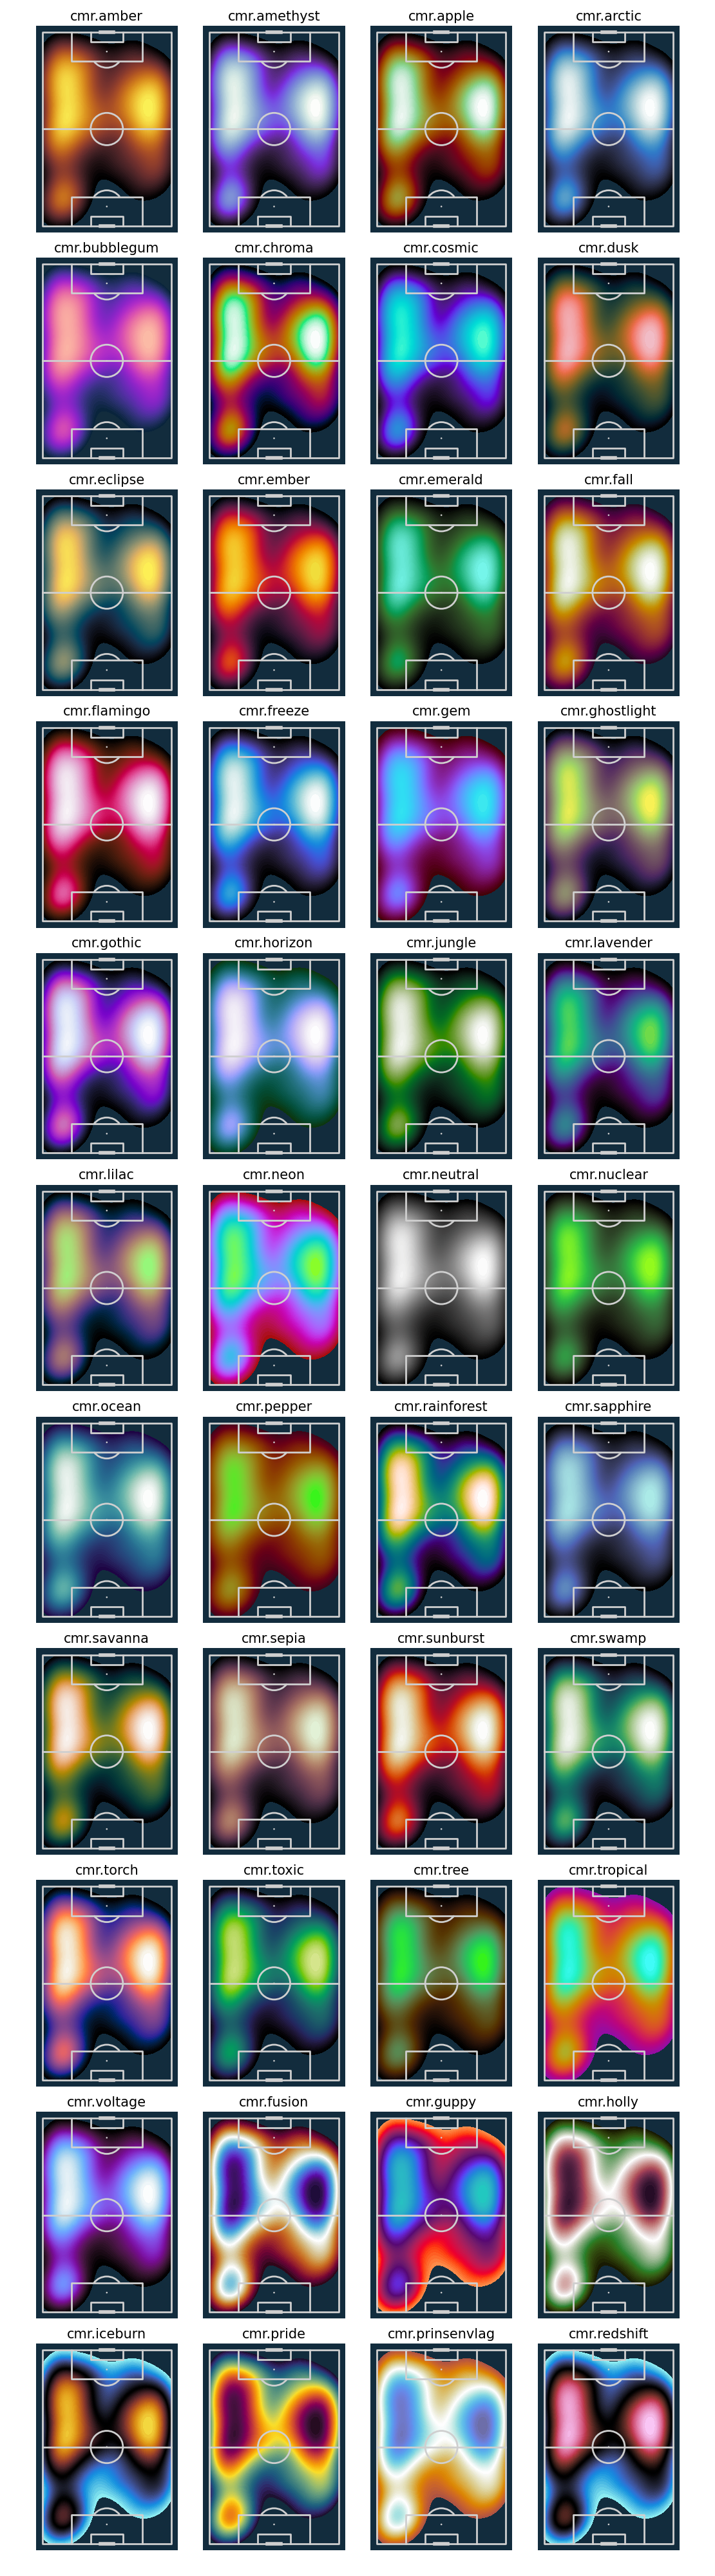
cmasher colormaps
Cmasher colormaps are scientific colormaps that have been designed to be perceptually uniform (i.e. color changes visually look the same as the value changes) and mostly colorblind friendly. A great choice to get started and potentially more exciting than the default matplotlib choices.
Let’s first get a dictionary of all the colormaps
See the docs for more info: https://cmasher.readthedocs.io/.
cmap_dict = cmr.cm.cmap_cd
all_cmap_dict = {}
for cmap_type_key in cmap_dict:
    for key, cmap in cmap_dict[cmap_type_key].items():
        if key[-2:] != '_r':
            all_cmap_dict[key] = cmap
Cmasher kdeplot
Here’s all the cmasher colormaps plotted as a grid so you can find your favorite.
pitch = VerticalPitch(line_color='#cfcfcf', line_zorder=2, pitch_color='#122c3d')
fig, axs = pitch.grid(nrows=11, ncols=4, space=0.1, figheight=40,
                      title_height=0, endnote_height=0,  # no title/ endnote
                      grid_width=0.9, grid_height=0.98, bottom=0.01, left=0.05)
cmap_names = list(all_cmap_dict.keys())
for idx, ax in enumerate(axs.flat):
    cmap_name = f'cmr.{cmap_names[idx]}'
    cmap = all_cmap_dict[cmap_names[idx]]
    kdeplot = pitch.kdeplot(df.x, df.y, ax=ax, cmap=cmap, fill=True, levels=100)
    ax_title = ax.set_title(cmap_name, fontsize=15)
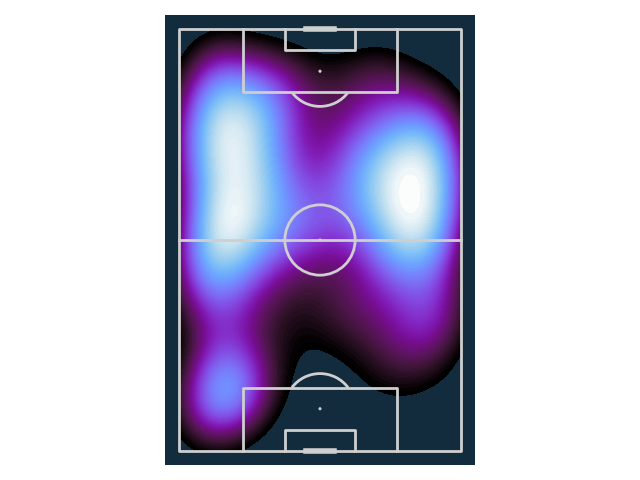
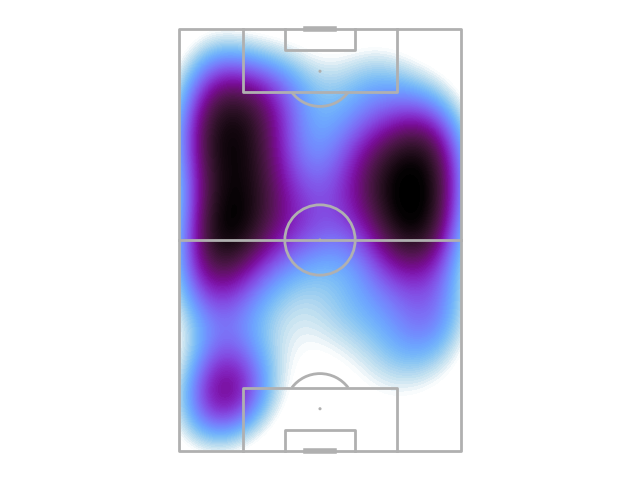
Cmasher kdeplot
I like the look of the voltage colormap so let’s plot in against a light and dark background
You can reverse any of the colormaps, by putting _r at the end, for example cmr.arctic_r (this also applies to matplotlib cmaps).
Reversing the colormaps is sometimes helpful so the high value colors do not bleed into the background. I prefer dark to light colormaps on dark background, and light to dark colormaps on light backgrounds. I have shown this below using the same colormap in reverse.
# dark
pitch_dark = VerticalPitch(line_color='#cfcfcf', line_zorder=2, pitch_color='#122c3d')
fig, ax = pitch_dark.draw()
kdeplot_dark = pitch_dark.kdeplot(df.x, df.y, ax=ax, cmap=cmr.voltage, fill=True, levels=100)

# light
pitch_light = VerticalPitch(line_zorder=2)
fig, ax = pitch_light.draw()
kdeplot_light = pitch_light.kdeplot(df.x, df.y, ax=ax, cmap=cmr.voltage_r, fill=True, levels=100)
Create colormaps using LinearSegmentedColormap
Sometimes its nice to make your own colormaps, maybe to even match team colors. In these examples we will use a list of two colors and the colormaps will linearly increase between these two colors (note you can do more such as use 3 colors).
For dark theme backgrounds, I prefer going from dark to light colors. This is so the null values which will take the dark background color are not mistaken for high values. Likewise, I prefer to go from light to dark colors when using a lighter background.
pearl_earring_cmap = LinearSegmentedColormap.from_list("Pearl Earring - 10 colors",
                                                       ['#15242e', '#4393c4'], N=10)
el_greco_violet_cmap = LinearSegmentedColormap.from_list("El Greco Violet - 10 colors",
                                                         ['#332a49', '#8e78a0'], N=10)
el_greco_yellow_cmap = LinearSegmentedColormap.from_list("El Greco Yellow - 10 colors",
                                                         ['#7c2e2a', '#f2dd44'], N=10)
flamingo_cmap = LinearSegmentedColormap.from_list("Flamingo - 10 colors",
                                                  ['#e3aca7', '#c03a1d'], N=10)
# same color maps but with 100 colors
pearl_earring_cmap_100 = LinearSegmentedColormap.from_list("Pearl Earring - 100 colors",
                                                           ['#15242e', '#4393c4'], N=100)
el_greco_violet_cmap_100 = LinearSegmentedColormap.from_list("El Greco Violet - 100 colors",
                                                             ['#3b3154', '#8e78a0'], N=100)
el_greco_yellow_cmap_100 = LinearSegmentedColormap.from_list("El Greco Yellow - 100 colors",
                                                             ['#7c2e2a', '#f2dd44'], N=100)
flamingo_cmap_100 = LinearSegmentedColormap.from_list("Flamingo - 100 colors",
                                                      ['#e3aca7', '#c03a1d'], N=100)
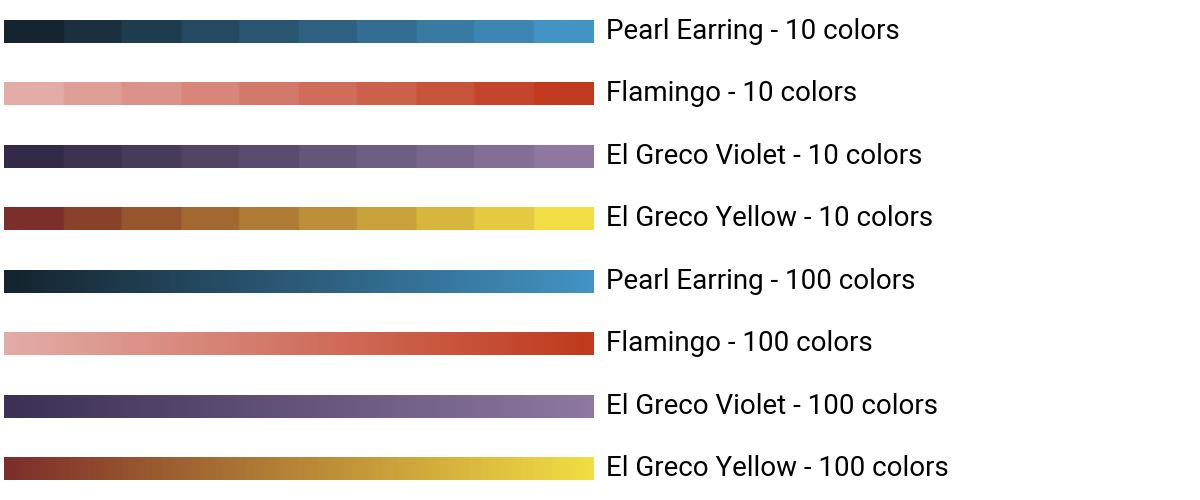
Show the colormaps
The below colormaps are inspired by art and nature: Girl with a Pearl by Johannes Vermeer, The Disrobing of Christ by El Greco, and flamingos.
With heatmaps and hexbins, I prefer to use fewer colors (N=10) so the values are mapped to fewer colors. While for smoother heatmaps when using kdeplot go for more colors (e.g. N=100).
fig, axes = plt.subplots(figsize=(12, 5), nrows=8, ncols=2, constrained_layout=True)
gradient = np.linspace(0, 1, 256)
gradient = np.repeat(np.expand_dims(gradient, axis=0), repeats=10, axis=0)
cmaps = [pearl_earring_cmap, flamingo_cmap,
         el_greco_violet_cmap, el_greco_yellow_cmap,
         pearl_earring_cmap_100, flamingo_cmap_100,
         el_greco_violet_cmap_100, el_greco_yellow_cmap_100]
fm = FontManager()
for i, cmap in enumerate(cmaps):
    axes[i, 0].axis('off')
    axes[i, 1].axis('off')
    axes[i, 0].imshow(gradient, cmap=cmap)
    axes[i, 1].text(0, 0.5, cmap.name, va='center', fontsize=20, fontproperties=fm.prop)
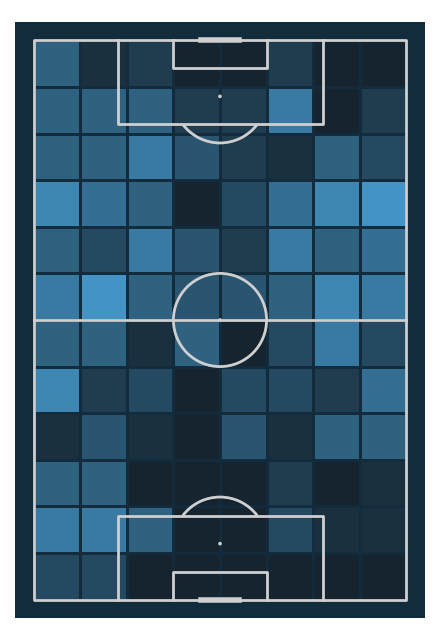
Cyan colormap heatmap
pitch = VerticalPitch(line_color='#cfcfcf', line_zorder=2, pitch_color='#122c3d')
fig, ax = pitch.draw(figsize=(4.4, 6.4))
bs = pitch.bin_statistic(df.x, df.y, bins=(12, 8))
heatmap = pitch.heatmap(bs, edgecolors='#122c3d', ax=ax, cmap=pearl_earring_cmap)
Cyan colormap hexbin
fig, ax = pitch.draw()
hexmap = pitch.hexbin(df.x, df.y, ax=ax, edgecolors='#122c3d', gridsize=(8, 8),
                      cmap=pearl_earring_cmap)

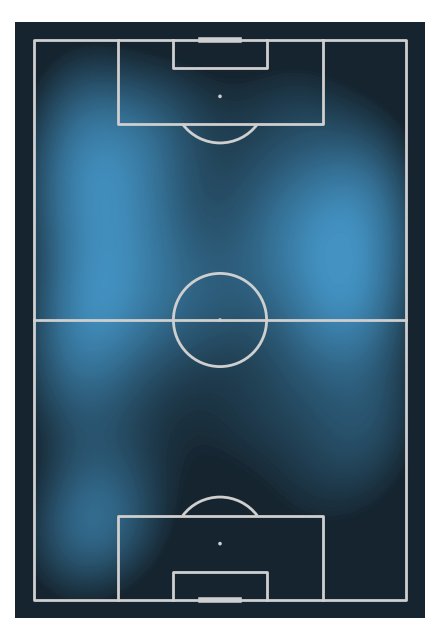
Cyan colormap kdeplot
pitch = VerticalPitch(line_color='#cfcfcf', line_zorder=2, pitch_color='#15242e')
fig, ax = pitch.draw(figsize=(4.4, 6.4))
# note use the colormap with 100 colors for a smoother finish
# sphinx_gallery_thumbnail_path = 'gallery/pitch_plots/images/sphx_glr_plot_cmap_007.png'
kdeplot = pitch.kdeplot(df.x, df.y, ax=ax, cmap=pearl_earring_cmap_100, fill=True, levels=100)
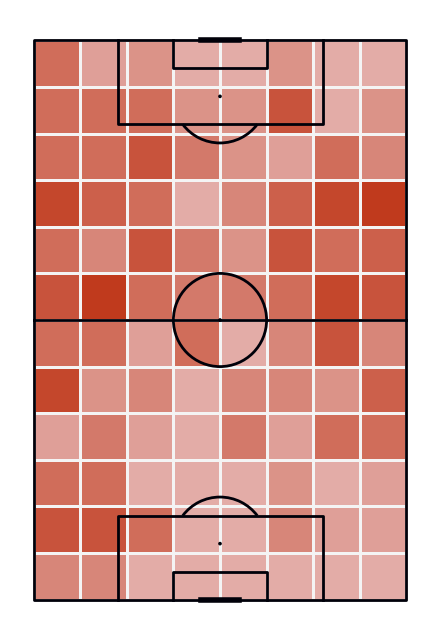
Flamingo colormap heatmap
pitch = VerticalPitch(line_color='#000009', line_zorder=2, pitch_color='white')
fig, ax = pitch.draw(figsize=(4.4, 6.4))
bs = pitch.bin_statistic(df.x, df.y, bins=(12, 8))
heatmap = pitch.heatmap(bs, ax=ax, edgecolors='#f4f4f4', cmap=flamingo_cmap)
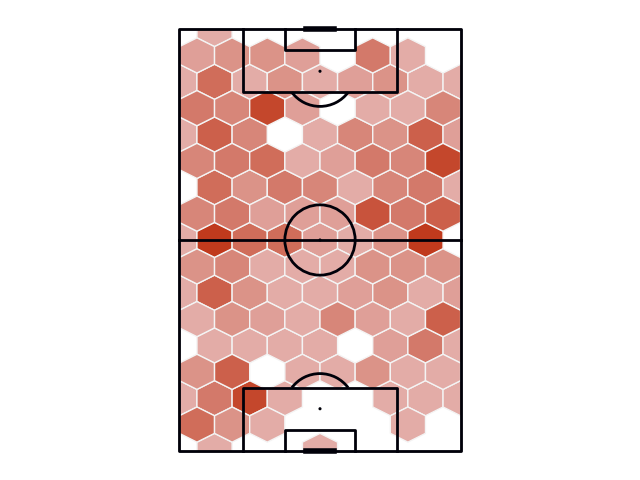
Flamingo colormap hexbin
fig, ax = pitch.draw()
hexmap = pitch.hexbin(df.x, df.y, ax=ax, edgecolors='#f4f4f4', gridsize=(8, 8), cmap=flamingo_cmap)
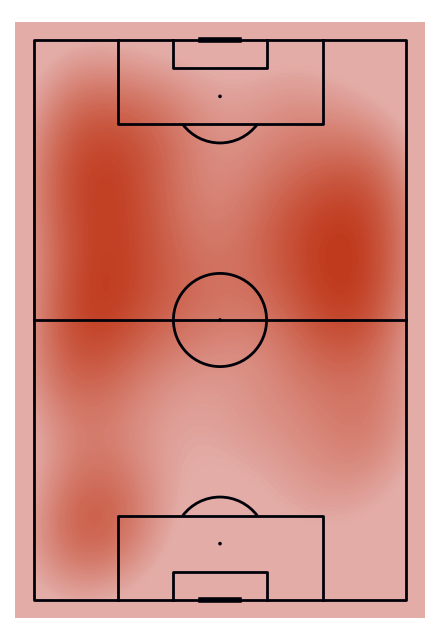
Flamingo colormap kdeplot
pitch = VerticalPitch(line_color='#000009', line_zorder=2, pitch_color='#e3aca7')
fig, ax = pitch.draw(figsize=(4.4, 6.4))
kdeplot = pitch.kdeplot(df.x, df.y, ax=ax, cmap=flamingo_cmap_100, fill=True, levels=100)
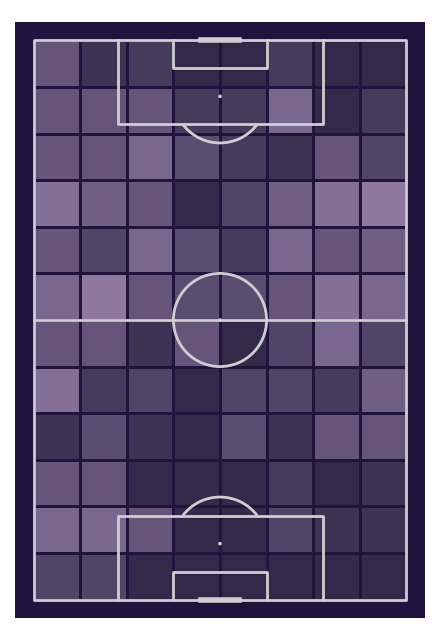
Violet colormap heatmap
pitch = VerticalPitch(line_color='#cfcfcf', line_zorder=2, pitch_color='#20143f')
fig, ax = pitch.draw(figsize=(4.4, 6.4))
bs = pitch.bin_statistic(df.x, df.y, bins=(12, 8))
heatmap = pitch.heatmap(bs, ax=ax, edgecolors='#20143f', cmap=el_greco_violet_cmap)
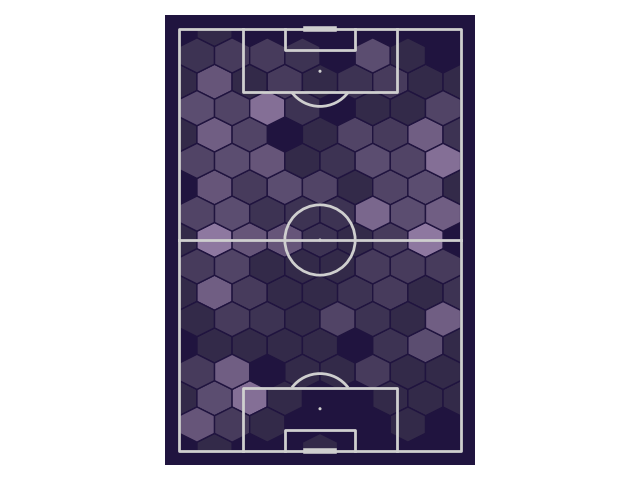
Violet colormap hexbin
fig, ax = pitch.draw()
hexbin = pitch.hexbin(df.x, df.y, ax=ax, edgecolors='#20143f',
                      gridsize=(8, 8), cmap=el_greco_violet_cmap)
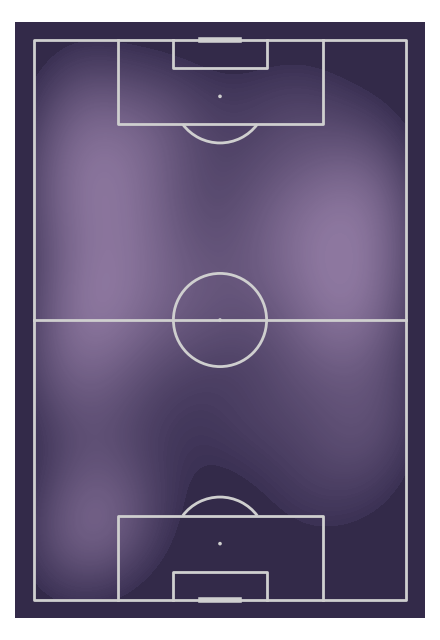
Violet colormap kdeplot
pitch = VerticalPitch(line_color='#cfcfcf', line_zorder=2, pitch_color='#332a49')
fig, ax = pitch.draw(figsize=(4.4, 6.4))
kdeplot = pitch.kdeplot(df.x, df.y, ax=ax, cmap=el_greco_violet_cmap_100, fill=True, levels=100)
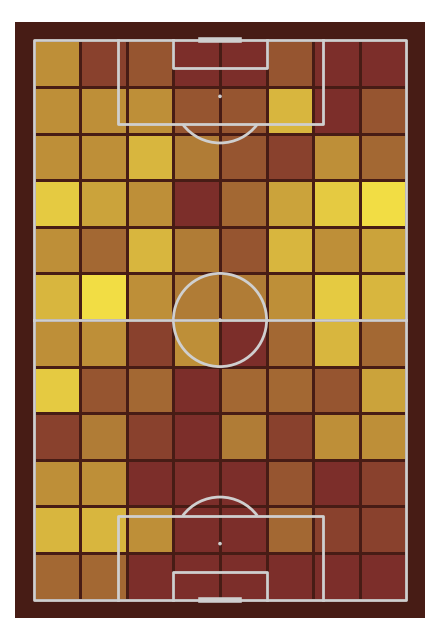
Yellow colormap heatmap
pitch = VerticalPitch(line_color='#cfcfcf', line_zorder=2, pitch_color='#471c15')
fig, ax = pitch.draw(figsize=(4.4, 6.4))
bs = pitch.bin_statistic(df.x, df.y, bins=(12, 8))
heatmap = pitch.heatmap(bs, ax=ax, edgecolors='#471c15', cmap=el_greco_yellow_cmap)
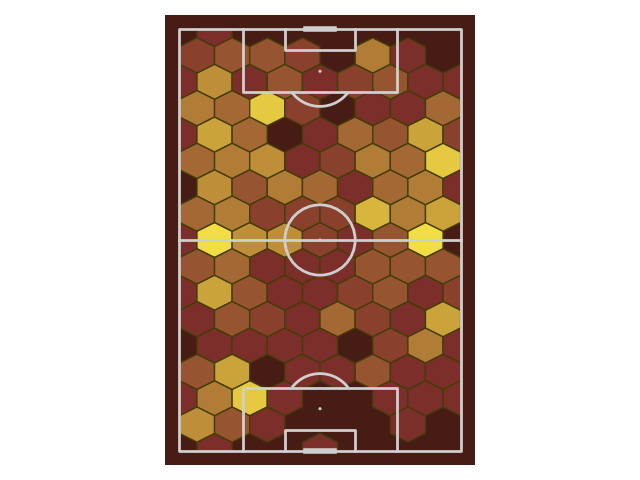
Yellow colormap hexbin
fig, ax = pitch.draw()
hexbin = pitch.hexbin(df.x, df.y, ax=ax, edgecolors='#443d07',
                      gridsize=(8, 8), cmap=el_greco_yellow_cmap)
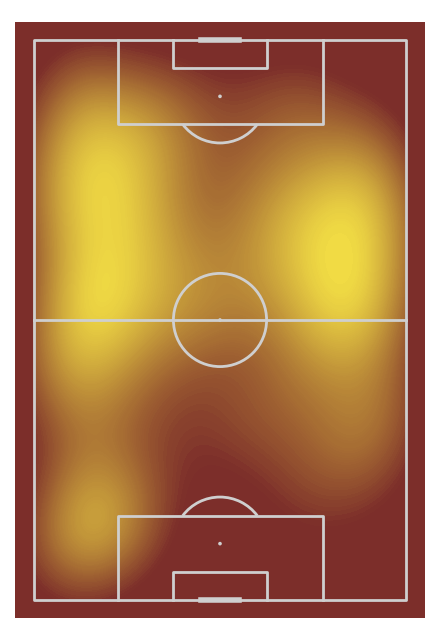
Yellow colormap kdeplot
pitch = VerticalPitch(line_color='#cfcfcf', line_zorder=2, pitch_color='#7c2e2a')
fig, ax = pitch.draw(figsize=(4.4, 6.4))
kdeplot = pitch.kdeplot(df.x, df.y, ax=ax, cmap=el_greco_yellow_cmap_100, fill=True, levels=100)

plt.show()  # If you are using a Jupyter notebook you do not need this line
Total running time of the script: (0 minutes 12.388 seconds)