Note
Go to the end to download the full example code.
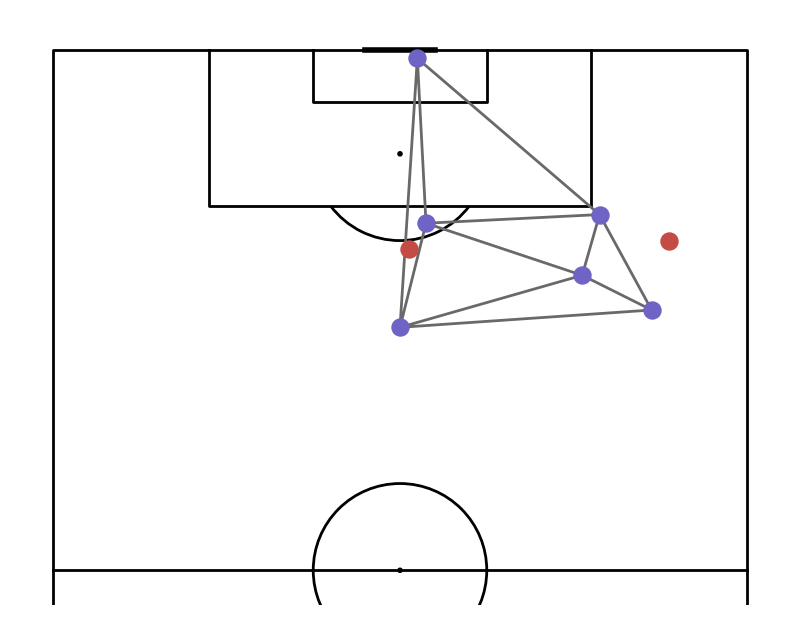
Plots Delaunay Tessellation of Players
This example shows how to plot the delaunay tesellation for a shot freeze frame
Added by Matthew Williamson
import matplotlib.pyplot as plt
import numpy as np
import pandas as pd

from mplsoccer import VerticalPitch, Sbopen

# get event and freeze frame data for game 7478
parser = Sbopen()
df_event, related, df_freeze, tactics = parser.event(7478)
Subset a shot
SHOT_ID = '974211ad-df10-4fac-a61c-6329e0c32af8'
df_freeze_frame = df_freeze[df_freeze.id == SHOT_ID].copy()
df_shot_event = df_event[df_event.id == SHOT_ID].dropna(axis=1, how='all').copy()
Location dataset
df = pd.concat([df_shot_event[['x', 'y']], df_freeze_frame[['x', 'y']]])

x = df.x.values
y = df.y.values
teams = np.concatenate([[True], df_freeze_frame.teammate.values])
Plotting
# draw plot
pitch = VerticalPitch(half=True, pitch_color='w', line_color='k')
fig, ax = pitch.draw(figsize=(8, 6.2))

# Get positions of Team B - which we'll use for plotting
team_b_x = x[~teams]
team_b_y = y[~teams]

# Plot triangles
t1 = pitch.triplot(team_b_x, team_b_y, ax=ax, color='dimgrey', linewidth=2)

# Plot players
sc1 = pitch.scatter(x[teams], y[teams], ax=ax, c='#c34c45', s=150, zorder=10)
sc2 = pitch.scatter(team_b_x, team_b_y, ax=ax, c='#6f63c5', s=150, zorder=10)

plt.show()  # If you are using a Jupyter notebook you do not need this line
Total running time of the script: (0 minutes 0.287 seconds)