Note
Go to the end to download the full example code.
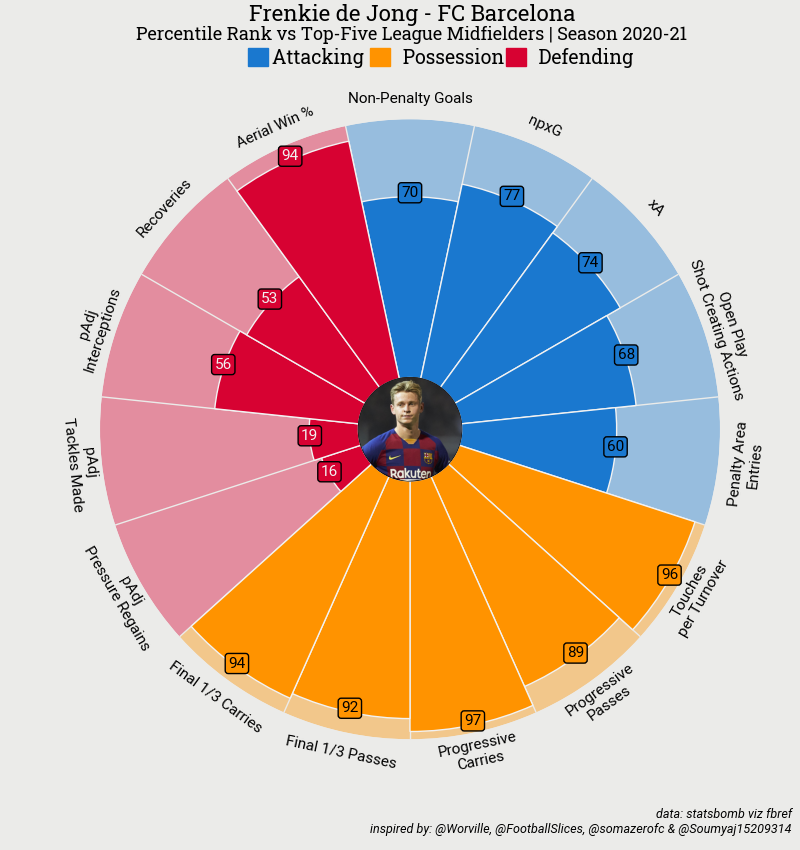
Colorful Pizza (Percentiles)
Author: slothfulwave612
mplsoccer,py_pizzamodule helps one to plot pizza charts in a few lines of code.The design idea is inspired by Tom Worville, Football Slices and Soma Zero FC
We have re-written Soumyajit Bose’s pizza chart code to enable greater customisation.
Here we plot a pizza chart with different colors for each slice.
from urllib.request import urlopen

import matplotlib.pyplot as plt
from PIL import Image

from mplsoccer import PyPizza, add_image, FontManager
Load some fonts
We will use mplsoccer’s FontManager to load some fonts from Google Fonts. We borrowed the FontManager from the excellent ridge_map library.
font_normal = FontManager('https://raw.githubusercontent.com/googlefonts/roboto/main/'
                          'src/hinted/Roboto-Regular.ttf')
font_italic = FontManager('https://raw.githubusercontent.com/googlefonts/roboto/main/'
                          'src/hinted/Roboto-Italic.ttf')
font_bold = FontManager('https://raw.githubusercontent.com/google/fonts/main/apache/robotoslab/'
                        'RobotoSlab[wght].ttf')
Load Image
Load a cropped image of Frenkie de Jong.
URL = "https://raw.githubusercontent.com/andrewRowlinson/mplsoccer-assets/main/fdj_cropped.png"
fdj_cropped = Image.open(urlopen(URL))
Multiple Slice Colors
Here we show an example where the slice colors are set via lists.
# parameter list
params = [
    "Non-Penalty Goals", "npxG", "xA",
    "Open Play\nShot Creating Actions", "\nPenalty Area\nEntries",
    "Touches\nper Turnover", "Progressive\nPasses", "Progressive\nCarries",
    "Final 1/3 Passes", "Final 1/3 Carries",
    "pAdj\nPressure Regains", "pAdj\nTackles Made",
    "pAdj\nInterceptions", "Recoveries", "Aerial Win %"
]

# value list
# The values are taken from the excellent fbref website (supplied by StatsBomb)
values = [
    70, 77, 74, 68, 60,
    96, 89, 97, 92, 94,
    16, 19, 56, 53, 94
]

# color for the slices and text
slice_colors = ["#1A78CF"] * 5 + ["#FF9300"] * 5 + ["#D70232"] * 5
text_colors = ["#000000"] * 10 + ["#F2F2F2"] * 5

# instantiate PyPizza class
baker = PyPizza(
    params=params,                  # list of parameters
    background_color="#EBEBE9",     # background color
    straight_line_color="#EBEBE9",  # color for straight lines
    straight_line_lw=1,             # linewidth for straight lines
    last_circle_lw=0,               # linewidth of last circle
    other_circle_lw=0,              # linewidth for other circles
    inner_circle_size=20            # size of inner circle
)

# plot pizza
fig, ax = baker.make_pizza(
    values,                          # list of values
    figsize=(8, 8.5),                # adjust figsize according to your need
    color_blank_space="same",        # use same color to fill blank space
    slice_colors=slice_colors,       # color for individual slices
    value_colors=text_colors,        # color for the value-text
    value_bck_colors=slice_colors,   # color for the blank spaces
    blank_alpha=0.4,                 # alpha for blank-space colors
    kwargs_slices=dict(
        edgecolor="#F2F2F2", zorder=2, linewidth=1
    ),                               # values to be used when plotting slices
    kwargs_params=dict(
        color="#000000", fontsize=11,
        fontproperties=font_normal.prop, va="center"
    ),                               # values to be used when adding parameter
    kwargs_values=dict(
        color="#000000", fontsize=11,
        fontproperties=font_normal.prop, zorder=3,
        bbox=dict(
            edgecolor="#000000", facecolor="cornflowerblue",
            boxstyle="round,pad=0.2", lw=1
        )
    )                                # values to be used when adding parameter-values
)

# add title
fig.text(
    0.515, 0.975, "Frenkie de Jong - FC Barcelona", size=16,
    ha="center", fontproperties=font_bold.prop, color="#000000"
)

# add subtitle
fig.text(
    0.515, 0.953,
    "Percentile Rank vs Top-Five League Midfielders | Season 2020-21",
    size=13,
    ha="center", fontproperties=font_bold.prop, color="#000000"
)

# add credits
CREDIT_1 = "data: statsbomb viz fbref"
CREDIT_2 = "inspired by: @Worville, @FootballSlices, @somazerofc & @Soumyaj15209314"

fig.text(
    0.99, 0.02, f"{CREDIT_1}\n{CREDIT_2}", size=9,
    fontproperties=font_italic.prop, color="#000000",
    ha="right"
)

# add text
fig.text(
    0.34, 0.925, "Attacking        Possession       Defending", size=14,
    fontproperties=font_bold.prop, color="#000000"
)

# add rectangles
fig.patches.extend([
    plt.Rectangle(
        (0.31, 0.9225), 0.025, 0.021, fill=True, color="#1a78cf",
        transform=fig.transFigure, figure=fig
    ),
    plt.Rectangle(
        (0.462, 0.9225), 0.025, 0.021, fill=True, color="#ff9300",
        transform=fig.transFigure, figure=fig
    ),
    plt.Rectangle(
        (0.632, 0.9225), 0.025, 0.021, fill=True, color="#d70232",
        transform=fig.transFigure, figure=fig
    ),
])

# add image
ax_image = add_image(
    fdj_cropped, fig, left=0.4478, bottom=0.4315, width=0.13, height=0.127
)   # these values might differ when you are plotting

plt.show()
Total running time of the script: (0 minutes 0.238 seconds)