Note
Go to the end to download the full example code.
Heatmap custom zones
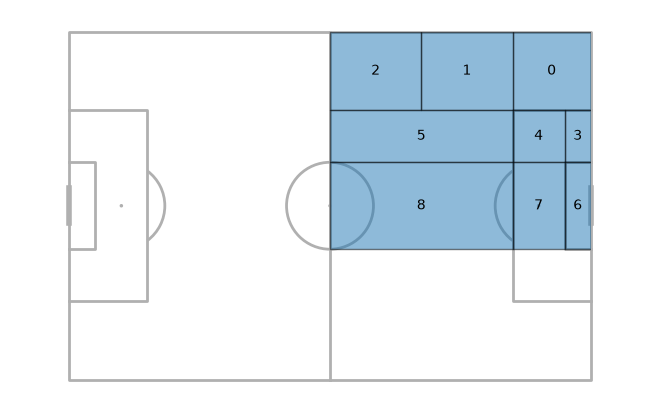
This example shows how to plot heatmaps for a custom zone layout.
Unlike bin_statistic, the zones do not have to form a regular grid,
so you can merge areas (e.g. a whole third) while splitting others
such as halfspaces. The zones are drawn as a single
matplotlib collection so colorbars work.
import matplotlib.patheffects as path_effects
import pandas as pd
from matplotlib.colors import LinearSegmentedColormap

from mplsoccer import Pitch, FontManager, Sbopen

# get data from three matches of Chelsea FC Women
parser = Sbopen()
match_files = [19789, 19794, 19805]
df = pd.concat([parser.event(file)[0] for file in match_files])  # 0 index is the event file
# filter chelsea pressure events
mask_chelsea_pressure = (df.team_name == 'Chelsea FCW') & (df.type_name == 'Pressure')
df = df.loc[mask_chelsea_pressure, ['x', 'y', 'duration']]
Custom colormap, font, and path effects
flamingo_cmap = LinearSegmentedColormap.from_list("Flamingo - 100 colors",
                                                  ['#e3aca7', '#c03a1d'], N=100)

# fontmanager for google font (robotto)
robotto_regular = FontManager()

path_eff = [path_effects.Stroke(linewidth=1.5, foreground='black'),
            path_effects.Normal()]
Define the zones
The zones are a list of lists, each sub-list is a rectangle (x0, x1, y0, y1) where x0 < x1 and y0 < y1. We will define it for half the pitch and mirror it later.
pitch = Pitch(pitch_type='statsbomb', line_zorder=2)
zones = [[pitch.dim.penalty_area_right, pitch.dim.right,
          pitch.dim.top, pitch.dim.penalty_area_top],
         [pitch.dim.positional_x[-3], pitch.dim.penalty_area_right,
          pitch.dim.top, pitch.dim.penalty_area_top],
         [pitch.dim.center_length, pitch.dim.positional_x[-3],
          pitch.dim.top, pitch.dim.penalty_area_top],
         [pitch.dim.six_yard_right, pitch.dim.right,
          pitch.dim.penalty_area_top, pitch.dim.six_yard_top],
         [pitch.dim.penalty_area_right, pitch.dim.six_yard_right,
          pitch.dim.penalty_area_top, pitch.dim.six_yard_top],
         [pitch.dim.center_length, pitch.dim.penalty_area_right,
          pitch.dim.penalty_area_top, pitch.dim.six_yard_top],
         [pitch.dim.six_yard_right, pitch.dim.right,
          pitch.dim.six_yard_top, pitch.dim.six_yard_bottom],
         [pitch.dim.penalty_area_right, pitch.dim.six_yard_right,
          pitch.dim.six_yard_top, pitch.dim.six_yard_bottom],
         [pitch.dim.center_length, pitch.dim.penalty_area_right,
          pitch.dim.six_yard_top, pitch.dim.six_yard_bottom],
        ]
fig, ax = pitch.draw(figsize=(6.6, 4.125))
# there is no validation so you can draw the
# zones iteratively and check for any overlaps and gaps
collection, annotations = pitch.draw_zones(zones, ax=ax)
Mirror the zones
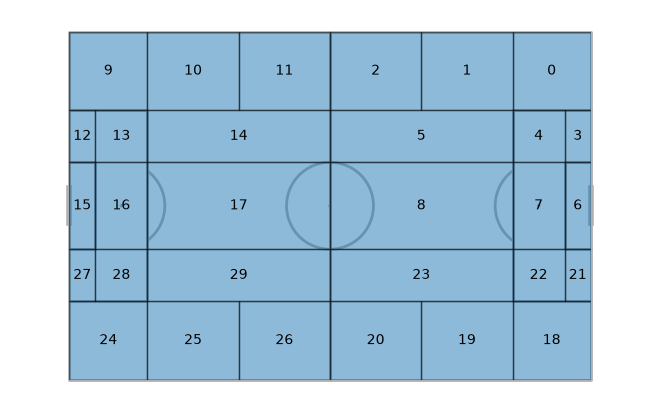
Layouts are often symmetric about the halfway line, so you can define one
half and complete the layout with mirror_zones. Zones that straddle
the halfway line symmetrically (like the middle zone here) are kept once.
zones_full, names_full = pitch.mirror_zones(zones, axis='both')
fig, ax = pitch.draw(figsize=(6.6, 4.125))
collection, annotations = pitch.draw_zones(zones_full, names_full, ax=ax)
Plot a custom zone heatmap
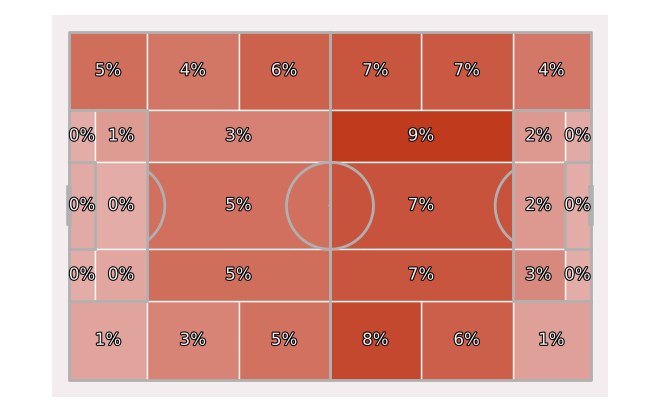
The zones are plotted with heatmap_zones as one
matplotlib.collections.PatchCollection, so fig.colorbar works
directly and label_heatmap labels the zone centres.
pitch = Pitch(pitch_type='statsbomb', line_zorder=2, pitch_color='#f4edf0')
fig, ax = pitch.draw(figsize=(6.6, 4.125))
stats = pitch.bin_statistic_zones(df.x, df.y, zones_full, names=names_full, normalize=True)
pc = pitch.heatmap_zones(stats, ax=ax, cmap=flamingo_cmap, edgecolor='#f9f9f9')
labels = pitch.label_heatmap(stats, color='#f4edf0', fontsize=12,
                             ax=ax, ha='center', va='center',
                             str_format='{:.0%}', path_effects=path_eff)
Total running time of the script: (0 minutes 1.066 seconds)