Note
Go to the end to download the full example code.
Curved text
This example shows how to draw text along a circular arc with mplsoccer’s
CurvedText artist. Radar uses it for curved parameter labels
(curved=True, see the
radar examples), and so does
PyPizza (curved_params=True, see the
pizza examples),
but you can also use it on normal axes.
import matplotlib.pyplot as plt
import numpy as np

from mplsoccer import CurvedText
Text around a circle
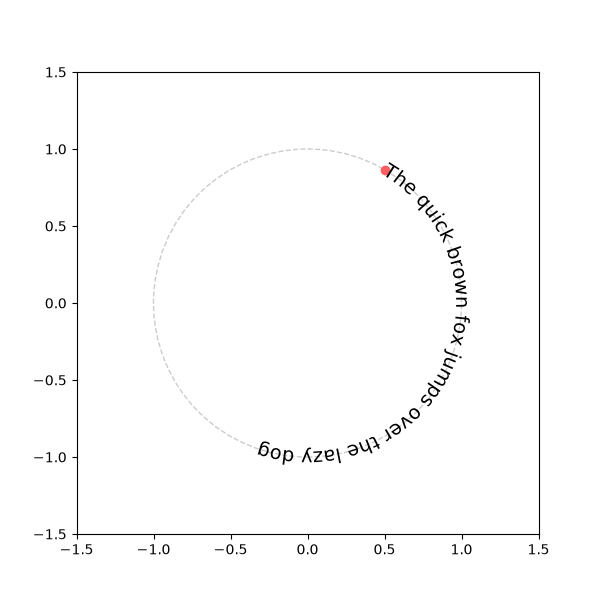
CurvedText has a similar signature to matplotlib’s text: you give it a position (x, y) and a string. The text curves along the circle that passes through (x, y) around the center point (by default the origin). Here the text starts at 30 degrees (the red dot) and flows clockwise.
fig, ax = plt.subplots(figsize=(6, 6))
ax.set_xlim(-1.5, 1.5)
ax.set_ylim(-1.5, 1.5)
ax.set_aspect('equal')

# draw the circle the text will follow, just for reference
ax.add_patch(plt.Circle((0, 0), 1, fill=False, color='#cccccc', linestyle='--'))

# start the text at 30 degrees (0 = top, increasing clockwise)
angle = np.radians(30)
x, y = np.sin(angle), np.cos(angle)
ax.plot(x, y, 'o', color='#fc5f5f')  # mark the start point

text = CurvedText(ax, x, y, 'The quick brown fox jumps over the lazy dog',
                  align='start', fontsize=14)
text_artist = ax.add_artist(text)
Alignment
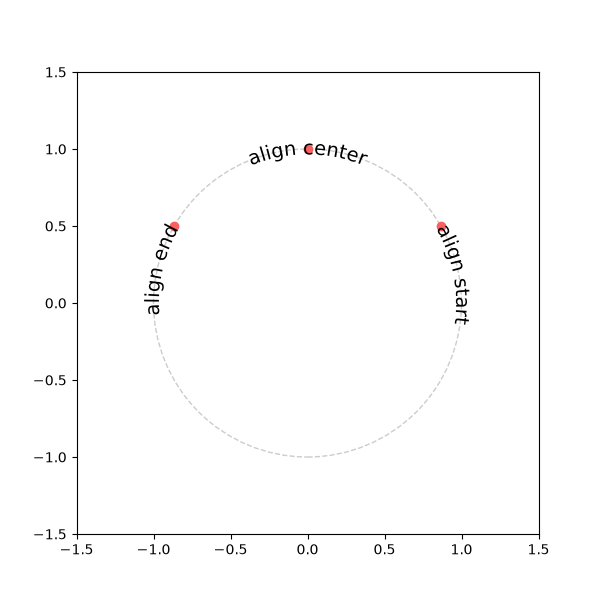
The align argument controls how the text sits relative to (x, y):
'start' begins the text at the point, 'center' (the default)
centers it on the point, and 'end' finishes the text at the point.
The names refer to the text’s reading direction along the arc rather than
left/right, because the direction can flip so the text stays readable
(see the next section).
fig, ax = plt.subplots(figsize=(6, 6))
ax.set_xlim(-1.5, 1.5)
ax.set_ylim(-1.5, 1.5)
ax.set_aspect('equal')
ax.add_patch(plt.Circle((0, 0), 1, fill=False, color='#cccccc', linestyle='--'))

for angle_degrees, align in [(60, 'start'), (0, 'center'), (-60, 'end')]:
    angle = np.radians(angle_degrees)
    x, y = np.sin(angle), np.cos(angle)
    ax.plot(x, y, 'o', color='#fc5f5f')
    text = CurvedText(ax, x, y, f'align {align}', align=align, fontsize=14)
    ax.add_artist(text)
Direction
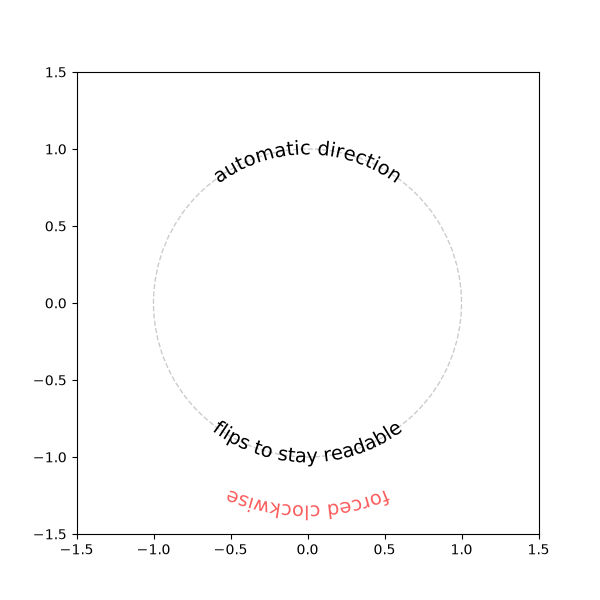
By default (direction='auto'), text in the lower half of the circle
flips so it reads left to right rather than upside down. You can force a
single direction with 'clockwise' or 'counterclockwise'.
fig, ax = plt.subplots(figsize=(6, 6))
ax.set_xlim(-1.5, 1.5)
ax.set_ylim(-1.5, 1.5)
ax.set_aspect('equal')
ax.add_patch(plt.Circle((0, 0), 1, fill=False, color='#cccccc', linestyle='--'))

text_top = CurvedText(ax, 0, 1, 'automatic direction', fontsize=14)
text_bottom = CurvedText(ax, 0, -1, 'flips to stay readable', fontsize=14)
text_forced = CurvedText(ax, 0, -1.35, 'forced clockwise', fontsize=14,
                         direction='clockwise', color='#fc5f5f')
for text in (text_top, text_bottom, text_forced):
    ax.add_artist(text)
Multiline text
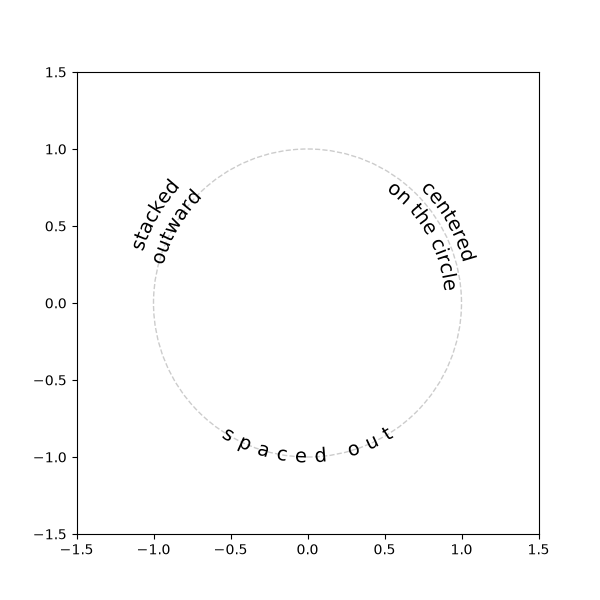
Newlines split the text into multiple arcs. The radial_anchor argument
controls how the lines stack relative to the circle through (x, y):
'inner' (the default) centers the innermost line on the circle with
further lines stacking outward, while 'center' centers the block of
lines on the circle. The letter_spacing argument adds extra space
(in points) between the characters.
fig, ax = plt.subplots(figsize=(6, 6))
ax.set_xlim(-1.5, 1.5)
ax.set_ylim(-1.5, 1.5)
ax.set_aspect('equal')
ax.add_patch(plt.Circle((0, 0), 1, fill=False, color='#cccccc', linestyle='--'))

text_inner = CurvedText(ax, -0.87, 0.5, 'stacked\noutward', fontsize=14)
text_center = CurvedText(ax, 0.87, 0.5, 'centered\non the circle', fontsize=14,
                         radial_anchor='center')
text_spaced = CurvedText(ax, 0, -1, 'spaced out', fontsize=14, letter_spacing=6)
for text in (text_inner, text_center, text_spaced):
    ax.add_artist(text)
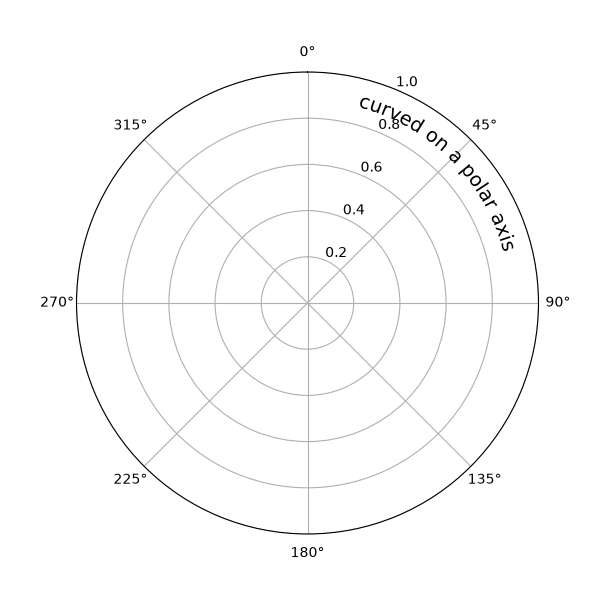
Polar axes
CurvedText also works on polar axes, where (like matplotlib’s text) x is
the angle theta in radians and y is the radius. The text curves around the
polar origin, respecting the axes’ theta direction, theta offset and
origin radius, so it works with the pizza charts. PyPizza uses this for
curved parameter labels via curved_params=True.
fig, ax = plt.subplots(figsize=(6, 6), subplot_kw={'projection': 'polar'})
ax.set_theta_zero_location('N')  # angle zero at the top
ax.set_theta_direction(-1)  # angles increase clockwise
ax.set_rmax(1)

text_polar = CurvedText(ax, np.radians(45), 0.9, 'curved on a polar axis',
                        fontsize=14)
ax.add_artist(text_polar)

plt.show()  # If you are using a Jupyter notebook you do not need this line
Total running time of the script: (0 minutes 0.409 seconds)