Note
Go to the end to download the full example code.
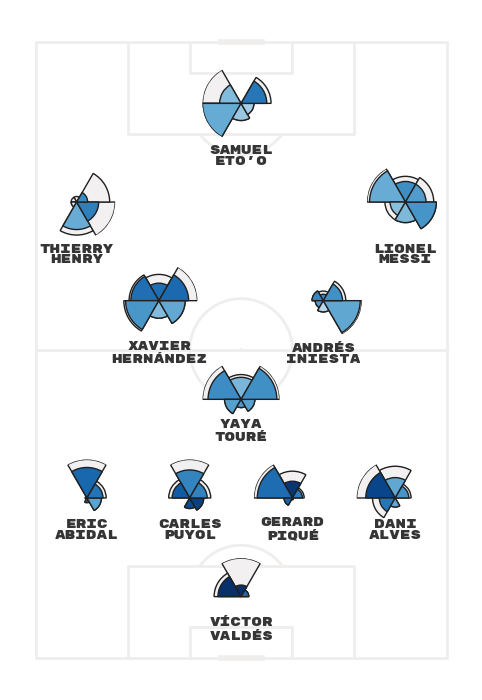
Sonar
StatsBomb has a great blog on the history of Sonars. Sonars show more information than heatmaps by introducing the angle of passes, shots or other events.
The following examples show how to use the sonar method to plot
a single sonar. I have copied a layout by
John Muller.
However, I encourage you to try out your variations as the API
allows you to mix and match different metrics for setting the slice length
and colors. Given the huge array of possible combinations, you should also
add a key to explain the viz because there isn’t a single standard for Sonars.
More information is available on how to customize the grid cells and segments in Bin Statistic Sonar.
import matplotlib.patheffects as path_effects
import matplotlib.pyplot as plt

from mplsoccer import VerticalPitch, Sbopen, FontManager

fm_rubik = FontManager('https://raw.githubusercontent.com/google/fonts/main/ofl/'
                       'rubikmonoone/RubikMonoOne-Regular.ttf')
path_eff = [path_effects.Stroke(linewidth=1, foreground='white'),
            path_effects.Normal()]
bins = (1, 1, 6)
Load the first game that Messi played as a false-9.
parser = Sbopen()
df_lineup = parser.lineup(69249)
df, _, _, df_tactics = parser.event(69249)

# get starting XI and formation
mask_start = (df.type_name == 'Starting XI') & (df.team_name == 'Barcelona')
formation = df.loc[mask_start, 'tactics_formation'].iloc[0]
start_id = df.loc[mask_start, 'id']
df_start = df_tactics[df_tactics['id'].isin(start_id)].copy()

# filter open-play passes
df_pass = df[(df.type_name == 'Pass') & (df.team_name == 'Barcelona') &
             (~df.sub_type_name.isin(['Free Kick', 'Throw-in',
                                      'Goal Kick', 'Kick Off', 'Corner']))].copy()
mask_success = df_pass['outcome_name'].isnull()
Add on the player short names manually
player_short_names = {'Víctor Valdés Arribas': 'Víctor Valdés',
                      'Daniel Alves da Silva': 'Dani Alves',
                      'Gerard Piqué Bernabéu': 'Gerard Piqué',
                      'Carles Puyol i Saforcada': 'Carles Puyol',
                      'Eric-Sylvain Bilal Abidal': 'Eric Abidal',
                      'Gnégnéri Yaya Touré': 'Yaya Touré',
                      'Andrés Iniesta Luján': 'Andrés Iniesta',
                      'Xavier Hernández Creus': 'Xavier Hernández',
                      'Lionel Andrés Messi Cuccittini': 'Lionel Messi',
                      'Thierry Henry': 'Thierry Henry',
                      "Samuel Eto''o Fils": "Samuel Eto'o"}
df_start['player_name'] = df_start['player_name'].map(player_short_names).str.replace(' ', '\n')
Plot the Sonars using average positions Here, we plot all attempted passes regardless of whether they were succesful.
pitch = VerticalPitch(line_color='#f0eded', pad_top=-30)
angle, distance = pitch.calculate_angle_and_distance(df_pass.x, df_pass.y, df_pass.end_x,
                                                     df_pass.end_y)

fig, ax = pitch.draw(figsize=(4.8215, 7))
for i, row in df_start.iterrows():
    mask = df_pass.player_id == row.player_id
    df_player = df_pass[mask]
    avg_x, avg_y = df_player.x.mean(), df_player.y.mean()
    ax_player = pitch.inset_axes(avg_x, avg_y, height=13, polar=True, zorder=2, ax=ax)
    bs_count_all = pitch.bin_statistic_sonar(df_pass[mask].x, df_pass[mask].y, angle[mask],
                                             bins=bins, center=True)
    bs_distance = pitch.bin_statistic_sonar(df_pass[mask].x, df_pass[mask].y, angle[mask],
                                            values=distance[mask], statistic='mean',
                                            bins=bins, center=True)
    pitch.sonar(bs_count_all, stats_color=bs_distance, vmin=0, vmax=30,
                cmap='Blues', ec='#202020', zorder=3, ax=ax_player)
    # adjust the text  little to avoid overlaps
    if row.player_name == 'Andrés\nIniesta':
        avg_y = avg_y - 6
    elif row.player_name == "Samuel\nEto'o":
        avg_y = avg_y + 4
    pitch.text(avg_x - 6, avg_y, row.player_name, va='center', ha='center', path_effects=path_eff,
               fontproperties=fm_rubik.prop, fontsize=9, color='#353535', zorder=5, ax=ax)

Plot the Sonars using formations Here, we use John Muller’s style of also plotting unsuccessful passes.
pitch = VerticalPitch(line_color='#f0eded')
fig, ax = pitch.draw(figsize=(4.8215, 7))
axs = pitch.formation(formation, positions=df_start.position_id, height=15, polar=True, kind='axes',
                      ax=ax)
player_text = pitch.formation(formation, positions=df_start.position_id,
                              xoffset=[-6, -6, -6, -6, -6, -6, -10, -10, -10, -10, -10],
                              text=df_start.player_name.tolist(), va='center', ha='center',
                              fontproperties=fm_rubik.prop,
                              fontsize=9, color='#353535', kind='text', ax=ax)

for key in axs.keys():
    player_id = df_start.loc[df_start.position_id == key, 'player_id'].iloc[0]
    mask = df_pass.player_id == player_id
    bs_count_all = pitch.bin_statistic_sonar(df_pass[mask].x, df_pass[mask].y, angle[mask],
                                             bins=bins, center=True)
    bs_count_success = pitch.bin_statistic_sonar(df_pass[mask & mask_success].x,
                                                 df_pass[mask & mask_success].y,
                                                 angle[mask & mask_success],
                                                 bins=bins, center=True)
    bs_distance = pitch.bin_statistic_sonar(df_pass[mask].x, df_pass[mask].y, angle[mask],
                                            values=distance[mask], statistic='mean',
                                            bins=bins, center=True)
    pitch.sonar(bs_count_success, stats_color=bs_distance, vmin=0, vmax=30,
                cmap='Blues', ec='#202020', zorder=3, ax=axs[key])
    pitch.sonar(bs_count_all, color='#f2f0f0', zorder=2, ec='#202020', ax=axs[key])

plt.show()  # If you are using a Jupyter notebook you do not need this line
Total running time of the script: (0 minutes 1.504 seconds)